

Estimated 2010 Performance For Irish Dairy Herds
Milk prices and the volume of milk output increased in 2010, say Trevor Donnellan and Thia Hennessy from Teagasc.Estimated Input Usage and Price 2010
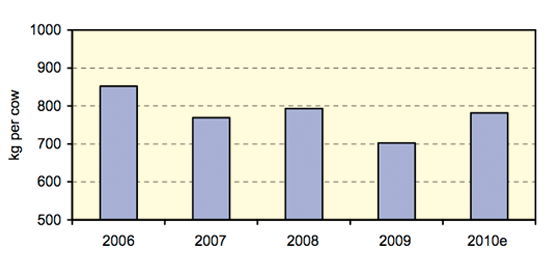
Feedstuff – usage and price 2010 Purchased feed (concentrates) typically accounts for about 20 per cent of total input expenditure on dairy farms, although this varies by farm and by year. Figure 1 shows the average volume of compound feed use per cow. This is derived by the authors from Department of Agriculture Fisheries and Food (DAFF) figures on feed sales and from Central Statistic Office (CSO) data on animal numbers. The observed year on year variability is normally largely weather related. However, due to volatile milk and feed prices, Irish milk yields per cow and overall milk production have fluctuated in the last three years which has also contributed to the annual variability in feed use.
Data, provided by DAFF, for the first nine months of 2010 indicates that aggregate dairy feed purchases were considerably ahead of the 2009 level, particularly in the third quarter. Based on this data source it would seem that the quantity of purchased compound dairy feed in 2010 is at least 10 per cent higher than the 2009 level. Preliminary data from the Teagasc Profit Monitor suggests that the increase in the volume of feed use in 2010 may have even been higher, possibly of the order of 15 per cent.
Milk prices have been around 30 cent per litre for much of 2010 and monthly milk production in the second half of 2010 has been well ahead of the depressed 2009 level, which may also have generated demand for additional feed in 2010. The extreme winter of 2009/10 was followed by a dry spring and near drought conditions in early summer, which made for poor grass growth. Reports suggest that there was an increase in the area under silage in 2010, creating an additional requirement to supplement the grass diet with concentrates in the summer months. Weather conditions in the second half of 2010 were more favourable for grass growth but the drive to boost milk production created further demand for feed supplementation in the second half of 2010.
Figure 1: Compound Feed Purchases per dairy cow in Ireland:National Average for 2006 to 2010
Note: e = estimate
Internationally, cereal prices rose rapidly in the second half of 2010 due to the reduced volume of cereals traded internationally and this price rise then began to be transmitted through to the feed market, with feed prices rising noticeably in the latter half of 2010. Figure 2 shows typical Irish dairy feed prices from 2006 to 2010.
Figure 2: Monthly Price Index of Dairy Meal (16-18% Protein) in Ireland 2006 to 2010
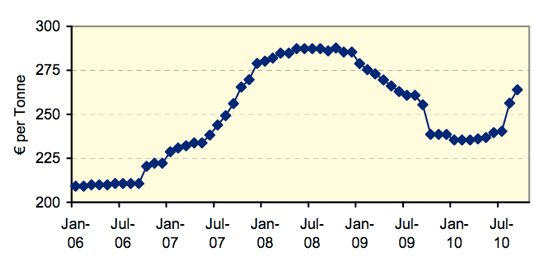
Based on the data available to date for 2010, the annual average feed price for 2010 is estimated to have fallen back to €248 per tonne, corresponding to a 3 per cent price decrease on the average 2009 level.
The 3 per cent decrease in feed prices in 2010, combined with the 15 per cent increase in dairy feed volume, suggest that total expenditure on dairy feed in 2010 increased by 12 per cent on the 2009 level.
Pasture and forage costs typically comprise about 20 per cent of total production costs on dairy farms. Fertiliser purchases comprise about half of this figure, with contractor costs accounting for most of the remainder.
The fall in nitrogen prices observed in 2009 was followed by a period of relatively stable prices for much of 2010. However, as 2010 drew to a close there were signs that another cycle of rising fertiliser prices may have begun.
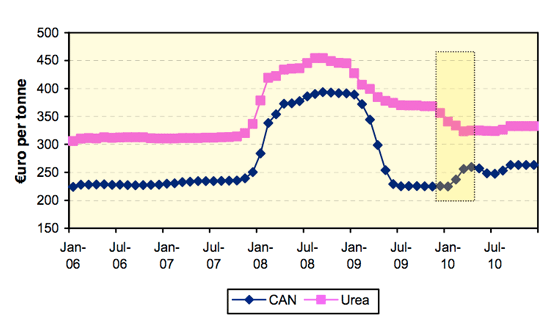
Figure 3 charts the monthly index of farm level fertiliser prices from 2006 through to 2010 in Ireland. In Ireland fertiliser prices reached their peak in December 2008 and while Urea prices were relatively flat in 2010, CAN prices began to move upwards once more, albeit from levels which are low relative to the price spike of 2007-2009. On a calendar year basis, fertiliser prices are down by about 15 per cent in 2010 relative to 2009. The decrease in CAN prices has not been as pronounced as in the case of Urea.
The bulk of the fertiliser purchasing on dairy farms takes place in the first half of the year. The typical fertiliser purchase period is indicated in Figure 3 by the highlighted observations in the early months of the year. On this basis, dairy farmers generally will have benefited from low fertiliser prices in 2010. It is estimated that the fertiliser prices paid by dairy farmers in the first half of 2010 were down 20 per cent in the case of CAN and down 17 per cent in the case of Urea relative to the corresponding period in 2009. On this basis, it is estimated that there was a 15 per cent decrease in fertiliser prices in 2010, although this may have varied somewhat depending on the time of purchase on individual farms.
Figure 3: Monthly Price Index of fertiliser (average of all compounds) in Ireland for 2006 to 2010
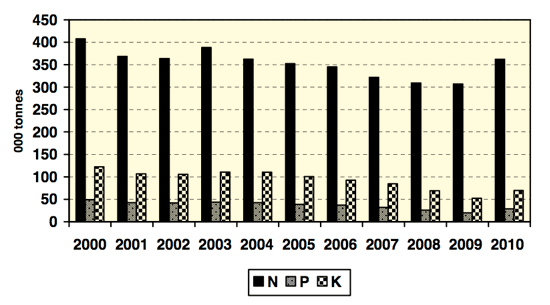
On the volume side, DAFF figures indicate that fertiliser sales in the 2010 fertiliser year (October 2009/September 2010) have increased substantially for all three elements, with larger increases recorded for P (up 47 per cent) and K (up 44 per cent) in comparison with N (up 23 per cent). These fertiliser sales data are reported in Figure 4. While these sales data are a good indicator of the direction of trend in fertiliser application, they are a less accurate reflection of the magnitude of such changes. In other words, the change in the application rate in 2010 relative to 2009 may not be as large as the sales data would suggest, as stock levels may have increased in 2010 in anticipation of higher prices in 2011. More definitive figures will be obtained from the National Farm Survey result for 2010 when these become available.
A number of reasons for this increase in fertiliser use in 2010 can be put forward. Firstly, fertiliser prices in 2010 were at their lowest level since 2006 which would itself encourage increased usage levels. Secondly, the high level of milk prices and the strong recovery in the volume of milk production in 2010 would have generated some additional fertiliser demand. Thirdly, it is considered that the continued sharp decline in fertiliser usage in the preceding 5 years (particularly in the case of P and K) may have led to nutrient deficits on some farms and a requirement that this be addressed in 2010.
Figure 4: Irish Fertiliser Sales by Compounders 2000 to 2010
It is estimated that fertiliser use on dairy farms increased by about 15 per cent in volume terms in 2010 relative to 2009. A more precise figure will be obtained from the forthcoming National Farm Survey results.
Overall, taking account of the decline in fertiliser price and increase in volume, this suggests that there has been a marginal decline of about 2 per cent in fertiliser expenditure on dairy farms in 2010 compared with the 2009 level.
Fertiliser costs comprise about 50 per cent of total pasture and forage costs, with the remaining half made up of contractor costs. While no official figures are available, there is reason to believe that there may have been some upward movement in contracting costs in 2010, reflecting the rise in fuel prices due to higher crude oil prices and the introduction in Ireland of the carbon tax. Reports also suggest that the silage area in 2010 was up on the 2009 level. On this basis, it is estimated that silage making costs increased by 5 per cent in 2010.
Pasture and Forage – usage and price 2010With fertiliser expenditure down 2 per cent relative to 2009, and contracting costs increasing by 5 per cent, the overall estimated increase in pasture and forage costs for 2010 is 2 per cent.
Energy and Fuel – usage and price 2009Energy and fuel are less important inputs in dairy production, comprising just 8 per cent of total costs on dairy farms. Electricity typically comprises about 30 per cent of the total expenditure on energy and fuel on dairy farms, with fuel accounting for the remaining 70 per cent.
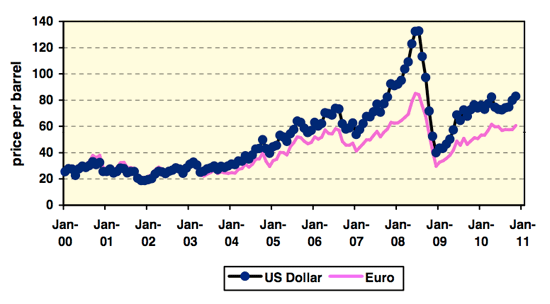
Motor Fuel: Crude oil prices are presented in Figure 5. Prices have moved over a wide range since 2005. This pattern continued in 2010 with oil rising from a monthly average of $74 per barrel (pb) in Jan 2010 to reach a monthly average of close to $90 pb in December 2010. The average price for 2010 was $76 pb.
The euro weakened versus the US dollar in 2010 which means that the extent of the per centage and absolute crude oil price increase relative to 2009 was larger when expressed in euro terms than in dollar terms. The average crude oil price for 2010 was €58, an increase of 32 per cent on the 2009 value of €44 pb. A carbon tax was introduced in mid 2010, which also put upward pressure on fuel prices in Ireland. Overall, as a result of rising crude oil prices, a weakening of the euro against the US dollar and the introduction of the carbon tax, fuel costs in Ireland have increased significantly, with diesel prices approximately 17 per cent higher in 2010 relative to the 2009 level.
Figure 5: Monthly Average Brent Crude oil prices in Euro and US dollar from 2000 to 2010
Electricity: Electricity costs change infrequently in Ireland due to price regulation. The most recent price change was a decrease in October 2009 and prices have been unchanged through 2010. On an annual average basis this means that prices have fallen by about 6 per cent in 2010, relative to 2009.
Energy and Fuel: Demand by farmers for fuel and electricity tends to be relatively inelastic with respect to price. Therefore, it is assumed that usage in 2010 will be on a par with the 2009 level. The overall expenditure on electricity in 2010 is anticipated to have decreased by 5 per cent on the 2009 level, while expenditure on fuel in 2010 is likely to have increased by 17 per cent on the 2009 level. Overall, expenditure on energy and fuel on dairy farms is estimated to have risen 10 per cent in 2010 relative to 2009.
All Other Direct and Fixed Costs– usage and price 2010 Agricultural wages in Ireland are unlikely to have changed in 2010. Again, it is assumed that the quantity of labour used on farms is likely to have changed little year on year. With the volume of labour assumed to be unchanged, labour costs are estimated to be unchanged in 2010 on the 2009 level. Reflecting general price deflation in the economy, it is estimated that the price of other input items fell by 2 per cent in 2010. It is assumed that usage of these input items will be unchanged and, as a result, the decrease in prices is reflected in a corresponding decrease in expenditure on these items.
Other fixed costs fell substantially in 2009 by about 2 cent per litre, largely reflecting lower depreciation and interest charges and it is estimated that other fixed costs rose by about 2 per cent in 2010.
Normally the year on year changes in national milk production in Ireland tends to be quite small due to the presence of the milk quota, which means that annual per cent changes in input expenditure tend to be similar whether expressed on an enterprise, hectare or litre basis. However, an important consideration in the cost story in 2010 is that the volume of milk production rose by 7 per cent nationally relative to 2009, and some of the increase in costs in 2010 is attributable to increased input usage to produce this additional output. The preceding discussion of costs reflected changes estimated on an enterprise basis. When the increase in milk output is taken into consideration and costs are expressed on a per litre basis, the cost story for 2010 is much more benign. The following text presents estimated changes in input expenditure for 2010 on a per litre basis.
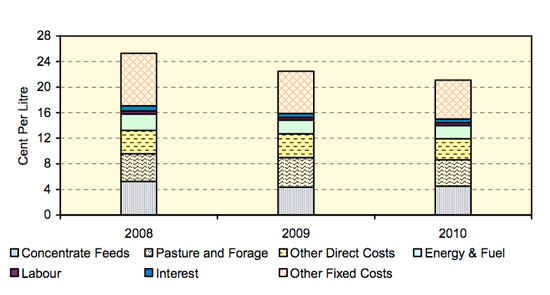
Figure 6 charts the average total costs of production for all creamery milk suppliers in 2009 and the corresponding estimates for 2010. It is estimated that the total costs of production for the average creamery milk supplier in Ireland in 2010 is 21.08 cent per litre. This is equivalent to a 6 per cent decrease in 2010 relative to 2009.
Figure 6: Total Costs of Milk Production in Ireland in 2008 and 2009, with estimates for 2010
Note: e = estimate
Estimated Output Values 2010
In Ireland the 2010 manufacturing milk price increased dramatically on the extremely low 2009 level. Monthly milk prices reached 30 cent per litre early in 2010 and were sustained at that level through the peak milk production period. Overall milk prices for the year averaged at just under 30 cent per litre on a vat inclusive basis, an increase of 29 per cent on the 2009 level.
The main contributor to the price increase was higher international dairy product prices brought about by strengthening international consumption as the global economy emerged from recession. Global milk supplies also increased but the extent of the increase in global import demand meant that higher international prices were required to clear the market. In the EU, the European Commission has been selective in its disposal of stocks which has also helped to keep dairy commodity prices at an elevated level.
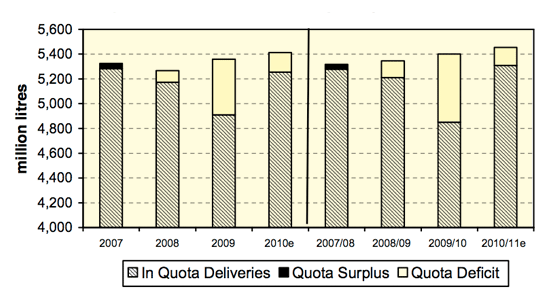
Despite a strong recovery in milk production in 2010, milk deliveries were below quota equivalent levels for the third successive year. However, 2010 was very much a year of two halves in terms of deliveries. For the first half of 2010 deliveries were below expectation, given the relatively high milk price, and were no better than in the corresponding period in 2009. However, there was a very strong increase in milk production in the second half of the 2010 and deliveries were about 15 per cent higher than in the latter half of 2009. Overall, milk production in the 2010 calendar year was up over 7 per cent on the 2009 level.
While this represents a considerable recovery in production following the contraction in 2008 and 2009, Irish milk production is still below milk quota levels. As of December 2010, on a milk quota year basis, production in the 2010/11 year was running almost 3 per cent below the milk quota.
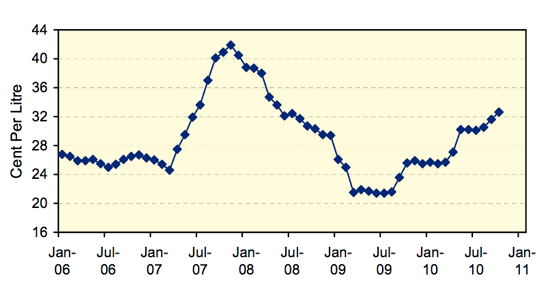
Figure 7 presents the standardised fat monthly milk prices recorded by CSO from 2006 through to October 2010. The upturn in prices on international dairy markets, which began late in 2009 and which has continued into 2010, is evident.
Figure 7: CSO Monthly Farm Gate Milk Prices (vat incl) 2006 - 2010
Note: 3.7 per cent fat (vat incl)
The average milk price for 2010 is estimated to be just under 30 cent/litre vat inclusive. This is an increase of 7 cent, or approximately 30 per cent, on the 2009 level. The impact of the higher 2010 milk price on the supply of Irish milk in 2010 can be observed in Figure 8.
Figure 8: Irish milk deliveries (fat adjusted) and quota surplus/deficit (calendar and quota year basis)
Note: Figures excludes imported milk for processing
e = estimate
On a calendar year basis Irish milk deliveries in 2010 will be above the 2009 level by about 7 per cent. Looking at milk production relative to the milk quota, as of December 2010 the trend in cumulative monthly milk deliveries was still running 3 per cent below the 2010/11 milk quota.
Review of Dairy Enterprise Net Margins in 2010
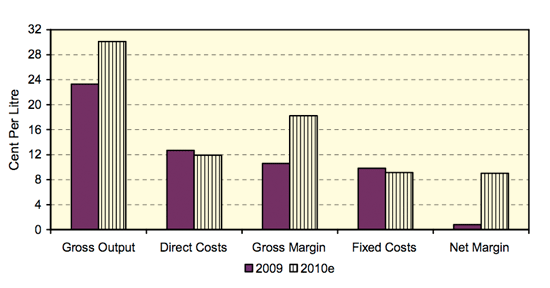
The review of milk prices showed that the average milk price for 2010 was almost 30 per cent up on the average for 2009, while the review of input costs concluded that total production costs on a per litre are estimated to have decreased by 6 per cent in 2010 relative to 2009. Figure 9 presents the estimated average gross output, production costs and net margin per litre for 2010 in comparison to 2009.
Figure 9: Gross output, Costs and Margins per litre for Creamery Milk Producers in Ireland in 2009 and estimated for 2010
Note: e = estimate
On a calendar year basis Irish milk deliveries in 2010 will be above the 2009 level by about 7 per cent. Looking at milk production relative to the milk quota, as of December 2010 the trend in cumulative monthly milk deliveries was still running 3 per cent below the 2010/11 milk quota.
Gross output values are estimated to have increased considerably in 2010 to just over 30 cpl, while input costs declined giving rise to a recovery in margins to 2008 levels. It is estimated that the average net margin per litre increased from less that 1 cpl in 2009 to 9 cpl in 2010.
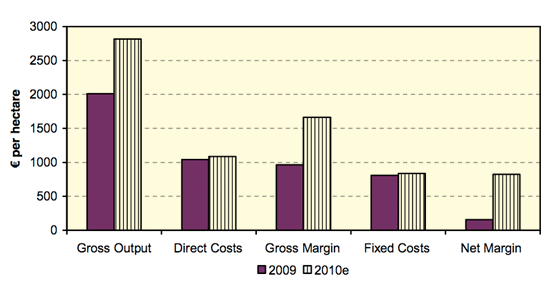
Net margin on a per hectare basis is set out in Figure 10. Net margin per hectare recorded a substantial increase from 2009 to 2010, rising from an average of €157 per hectare in 2009 to € 826 per hectare in 2010.
Figure 10: Gross output, Costs and Margins per hectare for Creamery Milk Producers in Ireland in 2009 and estimated for 2010
Note: e = estimate
It is estimated that gross output per hectare increased by 37 per cent from 2009 to 2010. This is considerably more than the increase recorded on a per litre basis and this is because there was an increase in the volume, as well as the value of production. Similarly costs of production increased more when expressed on a per hectare basis. Although the per unit cost of producing a litre of milk declined in 2010, the volume of production on a per hectare basis increased and therefore costs of production per hectare increased also. Net margin per hectare recorded an almost 5 fold increase in 2010 relative to 2009.
February 2011Further Reading
| - | You can view the full report by clicking here. |

