

US Dairy Outlook: May Milk Production Increased
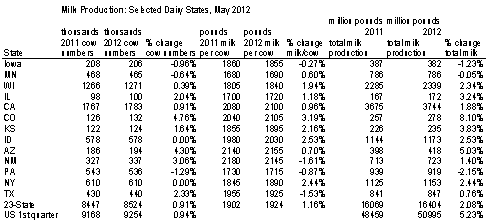
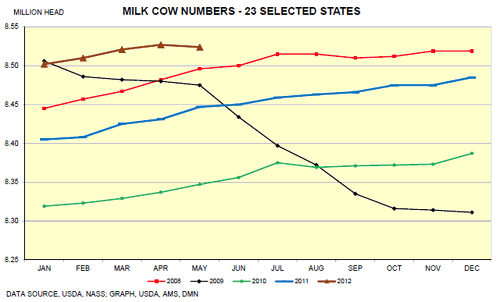
May 2012 23 major dairy states milk production increased 2.1 per cent. Production per cow was up by 22 pounds from one year ago, writes Kristen Schulte from the Iowa State University.Milk cow numbers were 77,000 more than May 2011 but 3,000 less than April 2012. April 2012 milk production was revised down 38 million pounds or 0.2 per cent. With the revision, April 2012 milk increased by 3.5 per cent.
Two states, Iowa and Pennsylvania produced less milk than one year ago; most of their declines were due to fewer cows. MO had the lowest milk per cow, 1390 pounds per cow for the month but maintained milk production from one year ago because milk per cow was higher than last year. UT had the largest milk increase, 8.3 per cent and CO the second largest increase, 8.2 per cent. Both Utah and CO added cows, 4000 in UT and 6000 in CO. AZ had strong milk production increase due mostly to an additional 8000 cows.
USDA’s “Livestock Slaughter” report said dairy producers sent 251,000 dairy cows to slaughter during May 2012, 11000 more than April 2012 and 31000 more than one year ago. During Jan-May period, US dairy producers culled 45000 more dairy cows than one year ago. Dairy cow numbers for the 23 states were 77000 higher than one year ago and we slaughtered an additional 31000 compared to one year ago. That means 108000 dairy heifers moved into the milking herd. As I mentioned previously, we have a large dairy heifer inventory.
Demand or Disappearance
Fluid milk demand continues to be lower than one year ago. YTD fluid milk is -2.7 per cent. Again Organic milk consumption rose, 8.2 per cent through March. Organic whole milk rose by 10.7 per cent YTD to 136 million pounds. Organic reduced fat milk sold was 164 million pounds.
Commercial disappearance of dairy products during the first three months of 2012 totals 49.3 billion pounds, 2.1 per cent above the same period in 2011. Comparing disappearance levels with year earlier levels: butter is +0.7 per cent; American cheese, +0.1 per cent; other cheese, +2.5 per cent; NDM, +25.0 per cent; and fluid milk products, -2.9 per cent.
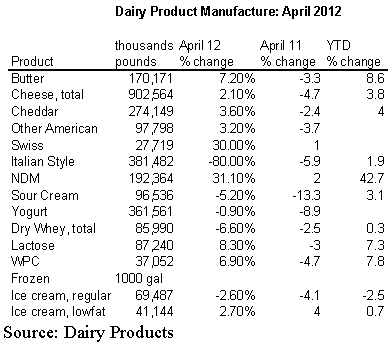
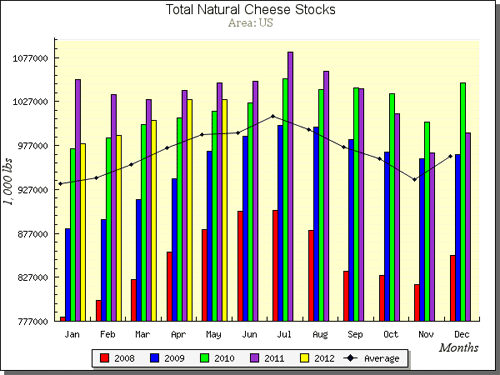
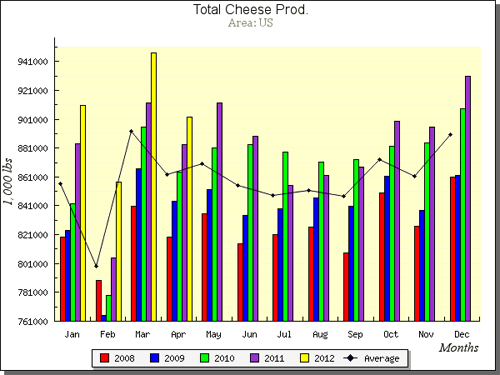
11 December-12 February Natural cheese stocks remained below 1 billion pounds but we have been over 1 billion since 12 March. May cheese stocks declined slightly mostly due to a drop in cheese production from March to April. Cheddar cheese production for April was up 3.6 per cent total American cheese was up 3.5 per cent, total cheese up 2.1 per cent and nonfat dry milk was up 31.1 per cent.
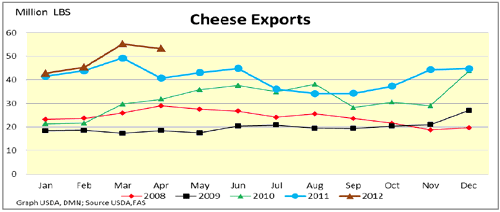
2012 US Dairy Exports are a bright spot in the dairy industry. Volumes and values are both up. Feb-April 12 was up 17 per cent for the period to $60 million. Volume of dry ingredients was 414,559 tons, up 5 per cent from last year. YTD total cheese is 12 per cent higher. And YTD total dairy product sales are 21 per cent higher. The largest single market is Mexico. YTD Mexico has purchased $413 million worth of dairy imports from the US, +28 per cent from last year. The second largest destination for US dairy exports, SE Asia, purchases are at $335 million for the year, a 7 per cent increase.
Analysis
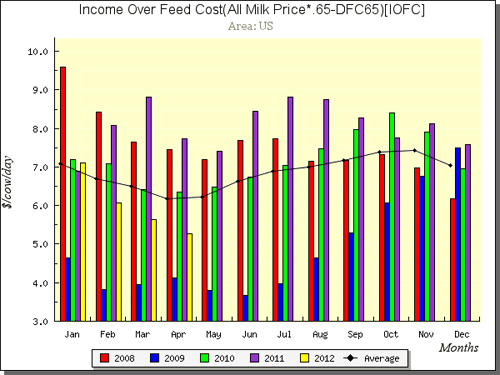
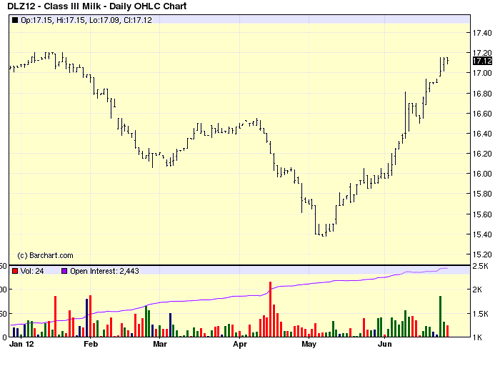
The April 2012 Income Over Feed Cost (IOFC) calculation for milk production is now at the lowest level since September 2009. It has declined since the beginning of the year. The last few day’s weather concerns have taken over the corn and soybean markets and pushed the corn price up to $1.50 per bushel higher. Corn condition reports continue to decline and no additional rainfall is predicted for the near-term to alleviate the situation. This does not bode well for US dairy producers. Fortunately Class III milk prices have been rising since early May.
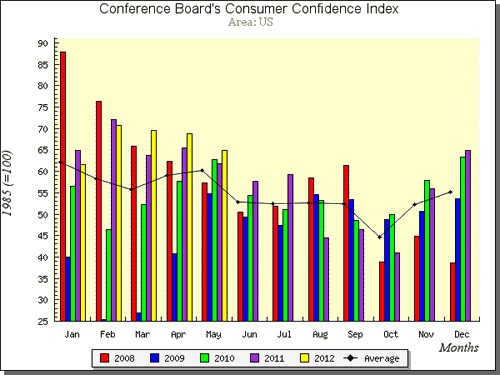
The Consumer Confidence Index has been declining since this past February to just below 65. On the other hand the Restaurant Industry Index has been above 100 since 11 October and is at 102.2 now. The expectations are also above 100. When these indices are above 100 restaurant performance and expected conditions is that expansion will occur. That would lead one to conclude that economic conditions are improving. However jobs data provides a less optimistic view.
July 2012

