

Review Of The Economic Performance Of Irish Dairy Farms in 2009
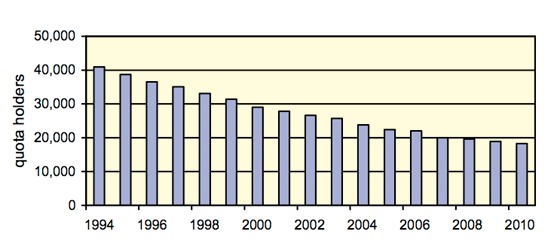
Trevor Donnellan and Thia Hennessy from Teagasc review dairy farm performance in 2009, saying that 2009 was a bad year for dairy producers.The number of active milk quota holders in Ireland continues to fall year on year. The latest figures published by the Department of Agriculture, Forestry and Food (DAFF) show that at the end of the 2009/10 milk quota year the number of active quota holders has fallen to 18,294, a decline of almost 600 on the preceding year. On average, almost 5 per cent of farmers have exited production each year over the last 18 years, with 3.5 per cent exiting in the 2009/10 quota year.
Figure 1: Number of Active Milk Quota Holders in Ireland 1994 to 2010
To place the economic performance of dairy farms in 2009 in context, we first compare the margin position in 2009 to 2008. Table 1 presents the average gross output, gross margin and net margin per litre of milk produced on all creamery milk farms in the NFS for 2008 and 2009
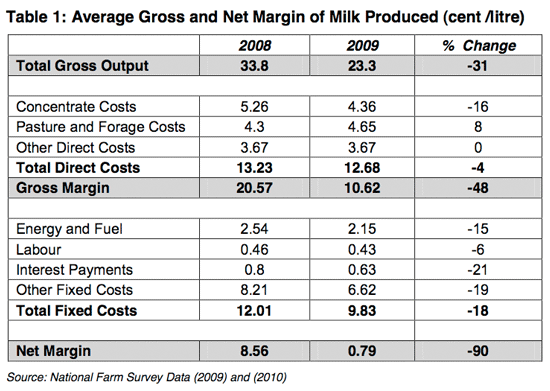
Gross output includes the value of milk and calf sales less replacement costs. Calf sales are worth on average 3 cent per litre (cpl) with only a small variation across farms. Replacement costs have typically been in the order to 2.5 to 2.7 cpl, so the profit from calf sales is almost completely eroded by replacement costs. The value of milk sales typically accounts for 95 per cent of gross output on the farm. As can be seen, gross output per litre fell by over 30 per cent from 2008 to 2009. Total direct costs were down by 4 per cent from 2008 to 2009 and as a result gross margin was down 48 per cent on a cent per litre basis. Total fixed costs decreased by 18 per cent from 2008 to 2009, mostly reflecting lower depreciation charges. The depreciation charge for buildings fell by almost 50 per cent on dairy farms from 2008 to 2009, reflecting reductions in construction costs. The net margin was on average less than 1 cent per litre in 2009, representing a 90 per cent reduction on the 2008 level.
Table 2 presents gross output, gross margin and net margin per hectare of forage area allocated to the dairy enterprise.
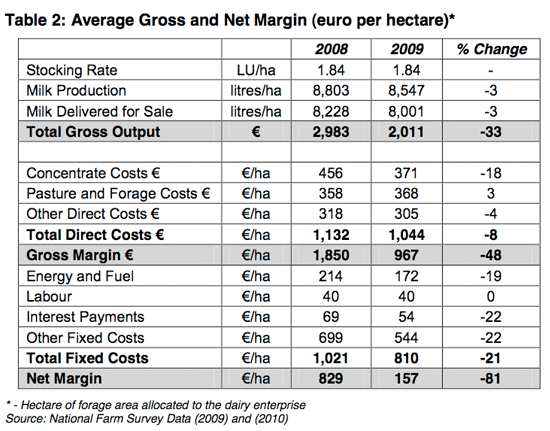
The trends in margin per hectare are similar to those presented in Table 1 above. Notably, there was a 3 per cent reduction in the milk output and milk deliveries per hectare in 2009. As there was no change in the average stocking rate from 2008 to 2009, the production decline was entirely due to lower deliveries per cow. The combination of a lower gross output per litre and lower production per hectare reduced gross output per hectare by 33 per cent from 2008 to 2009. Direct costs fell by a greater per centage on a per hectare basis (8 per cent), than a per litre basis (4 per cent), reflecting the lower levels of production per hectare. Fixed costs also fell by slightly more on a per hectare basis relative to a per litre basis. The net margin per hectare in 2009 was €157, an 81 per cent reduction on the 2008 level.
The tables above present the average levels of output, costs and profit for the sample of dairy farmers. However, there is a large variation in production costs and consequently profit across the full sample of dairy farms. To examine the variation in cost efficiency that exists in dairy farming, the weighted sample of 17,692 creamery milk suppliers are classified into three groups. In 2009 the national average cost of production was approximately 22.4 cent per litre (cpl). Farms are classified on the basis of production costs; the best performing one third of farms are labelled low cost, the middle one third are moderate cost and the poorest performing one third of dairy farms are classified as high cost. The variation in costs across farms is apparent from Figure 2.
Figure 2: Variation in Total Costs of Milk Production across all Creamery Milk Producers in Ireland in 2009
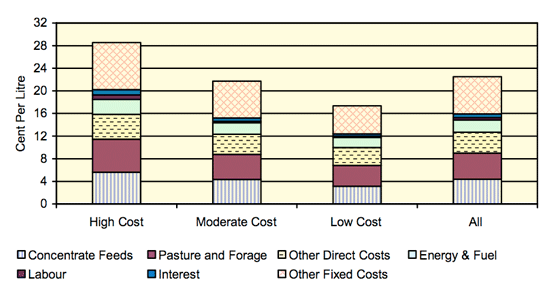
The average total cost of production on high cost farms in 2009 was 28.5 cpl, compared to 21.7 cpl on moderate cost farms and just 17.3 cpl on low cost farms. Across the range of creamery milk producers the difference in costs, between the average of the best performing one-third of producers and the average of the poorest performing farm group, was almost 11 cpl in 2009.
Purchased concentrate feeds and pasture and forage costs represent about 40 per cent of the total costs of production on dairy farms in 2009. Purchased concentrate feed costs varied from 3.1 cpl on low cost farms in 2007 to 5.6 cpl on high cost farms. The other direct costs category includes veterinary, AI and hire of machinery. These costs ranged from 3 cpl to 4.4 cpl from low to high cost farms. Fixed costs are broken into three categories; energy and fuel (including car, electricity, phone and all fuel used on the farm), labour (including casual and permanent hired labour) and all other fixed cost (including depreciation and maintenance of machinery, buildings and land). The variation in these costs across farms is relatively low.
Purchased concentrate feed is the most variable cost item across farms. The average quantity of concentrate feed fed per cow in 2009 was almost 900kg compared to almost 1,100kg in 2008. Figure 3 shows the large distribution of feed quantities per cow in 2009. Approximately 25 per cent of farmers fed 500kg per cow or less while at the opposite end of the distribution 25 per cent of farmers fed 1,100kg per cow or more.
Figure 3: Range of Concentrate Feed per Cow across all Dairy Farms: 2009
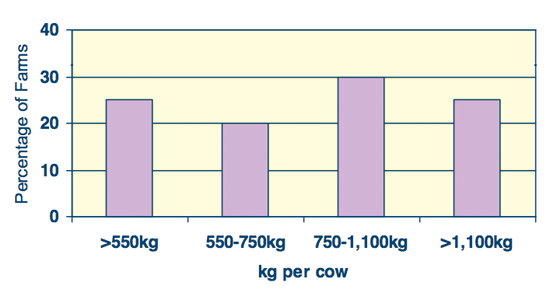
Figure 4 presents gross output and net margin for the three farm cost groupings. As is evident from Figure 4, the variation in gross output across farm groups is only marginal, with just a 3 per cent difference in the value of gross output per litre between the cost groupings. The variation in production costs has obvious implications for profit levels.
Figure 4: Variation in Net Margin across all Creamery Milk producers in Ireland in 2009
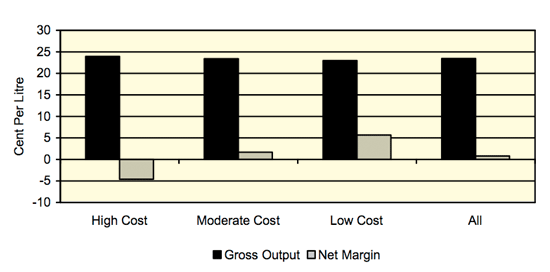
The average net margin on low cost farms in 2009 was 5.65 cpl compared to the middle group of farmers at 2 cpl and the poorest performing farms at an average of minus 4.6 cpl. This means that the difference in profit between the low and high cost groups for a typical 250,000 litre farm was €25,650 in 2009.
Figure 5: Variation in Total Costs of Milk Production across all Creamery Milk Producers in Ireland in 2000 to 2009
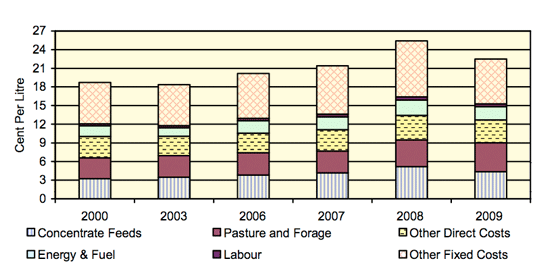
The year 2009 was one of the highest cost years experienced of the last ten years, only surpassed by the cost level in 2008. Although costs in 2009 were almost 15 per cent lower than 2008 levels, costs were still higher than 2007 and 2006 levels, as prices were slow to decline from the peak of 2008 for feed and fertiliser.
Figure 6 presents data on recent variations in profit levels on dairy farms from 2007 to 2009. As is evident, margins in 2009 were considerably lower than the 2007 and 2008 levels. Even on low cost farms, the average net margin per litre in 2009 was only 30 per cent of the level recorded in 2007.
Figure 6: Variation in Net Margin of Milk Production across all Creamery Milk Producers in Ireland in 2007 to 2009
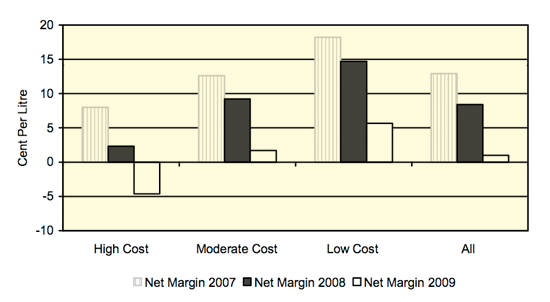
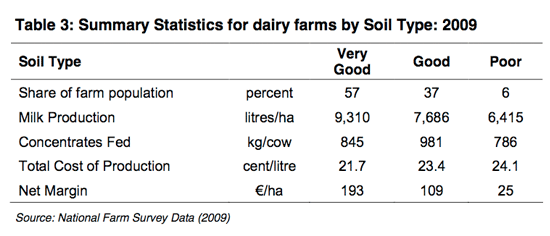
Table 3 provides a breakdown of some basic characteristics of dairy farms in 2009, stratified by soil type. The majority of farms are operated on very good soils. The bottom line in the table presents the difference in margins per hectare across the three soil categories. The difference between the returns on very good soils and poor soils is much more pronounced in 2009 than previous years. The margins achieved on the very good soils are over 7 times higher than the margins achieved on the poor soils. The difference in output per hectare across the three groups is apparent. Those on very good soils produce on average 20 per cent more milk per hectare than those on good soils and this higher production is achieved with lower levels of concentrate feed.
In summary, 2009 was a particularly poor year for milk prices and dairy farm margins, with a little over one third of farmers recording a negative net margin.
February 2010Further Reading
| - | You can view the full report by clicking here. |

