FAO Food Outlook - November 2010
The latest Global Market Outlook for animal products from the UN Food and Agriculture Organization (FAO). 27 November 2010
 4 minute read

Focus
International prices of most agricultural commodities have increased in recent months, some sharply. The FAO Food Price index has gained 34 points since the previous Food Outlook report in June, averaging 197 points in October, only 16 points short from its peak in June 2008. The upward movements of prices were connected with several factors, the most important of which were a worsening of the outlook for crops in key producing countries, which is likely to require large draw downs of stocks and result in tighter global supply and demand balances in 2010/11. Another leading factor has been the weakening of the United States Dollar (US Dollar) from mid-September, which continues to sustain the prices of nearly all agricultural and non-agricultural traded commodities. The increase in international prices of food commodities, all of which accruing in the second half of 2010, is boosting the overall food import bill in 2010 closer to the peak reached in 2008.
The pressure on prices to rise was first felt in the cereal market, most notably for wheat and barley, in August. This prompted FAO to call for an extraordinary meeting on 24 September 2010 to discuss the underlying causes and possible remedies. The meeting clearly identified the importance of reliable and upto- date information on crop supply and demand to cope with unexpected developments in world markets. More transparency and a better understanding of the role of commodity futures markets and government responses were also viewed as necessary to address price volatility. The full report of the meeting is included in the Special Feature section of this issue of Food Outlook.
(October 2009 - October 2010)
Attention is now turning to plantings for the next (2011/12) marketing season. Given the expectation of falling global inventories, the size of next year’s crops will be critical in setting the tone for stability in international markets. For major cereals, production must expand substantially to meet utilization and to reconstitute world reserves and farmers are likely to respond to the prevailing strong prices by expanding plantings. Cereals, however, may not be the only crops farmers will be trying to produce more of, as rising prices have also made other commodities attractive to grow, from soybeans to sugar and cotton. This could limit individual crop production responses to levels that would be insufficient to alleviate market tightness. Against this backdrop, consumers may have little choice but to pay higher prices for their food. With the pressure on world prices of most commodities not abating, the international community must remain vigilant against further supply shocks in 2011 and be prepared.
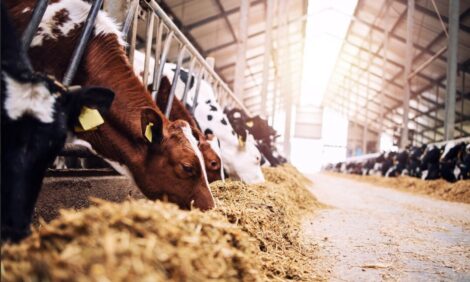
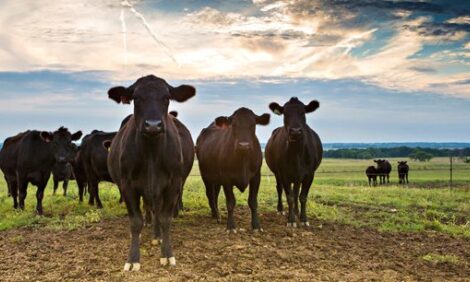
Meat and meat products market summary
World meat trade is forecast to grow by 2.8 per cent in 2010, to 26.1 million tonnes, sustained by a brisk growth in pig meat, but also by gains in bovine and poultry meat. However, in the case of poultry, the most widely traded meat, the expansion of world exports is likely to be constrained by the imposition of sanitary restrictions by major importers. Increased purchases from Asian countries are expected to fuel much of the expected increase of meat trade, more than compensating for a 15 per cent reduction of imports by the Russian Federation, which had emerged as the second largest meat importer in 2009, after China.
According to the FAO Meat Price Index, world meat prices between January and October 2010 averaged 14 per cent higher than in the same period in 2009, and similar to the levels witnessed in 2008.
(2002-2004 = 100)
Dairy market summary
Strong import demand from Asian countries and the Russian Federation has driven dairy product trade to historically high levels in 2010, with the demand largely met by higher exports from New Zealand and the United States. Dairy product prices in international trade have remained firm, in particular butter, which in October reached an all-time high.
(2002-2004 = 100)
FAO’s latest forecast of world dairy production for 2010 stands at 710.7 million tonnes, 1.7 per cent more than last year. Production in developed countries is forecast to grow by around 1 per cent, while that of developing countries may increase by 2.4 per cent. On a per capita basis, consumption of milk and milk products in developing countries may increase by 1 kg per capita in 2010, from 66.4 to 67.5 kg, fuelled by strong economic growth in Asia.
(2002-2004=100)
Fish and fishery products market summary
On average, the latest trade information indicates that two years after the drastic fall at the end of 2008, prices in September 2010 were only 1 per cent below the peak of September 2008, with aquaculture prices 11.6 per cent higher whereas prices of wild species were 10 per cent lower. According to the FAO Fish Price Index, prices over January to September were, on average, 8.5 per cent higher year-on-year.
Aquaculture producers of many of the exported commodities responded to the economic crisis in late 2008 and throughout 2009 by reducing stocking levels, thus affecting future production. Since then, demand in many developing countries has rebounded, especially in Asia and South America. Developed country demand for farmed products is picking up, and prices for products such as shrimp, catfish, tilapia and salmon have risen significantly in 2010. For capture fisheries, the picture is more mixed with some prices negatively affected by large harvests, whereas others have strengthened as lower fishing quotas resulted in reduced supply.
The price outlook for the rest of 2010 and early 2011 is positive, with demand firming in most markets and supply expected to remain stable.
Further Reading
| - | You can view the full report by clicking here. |
November 2010