

Australian Dairy Commodities
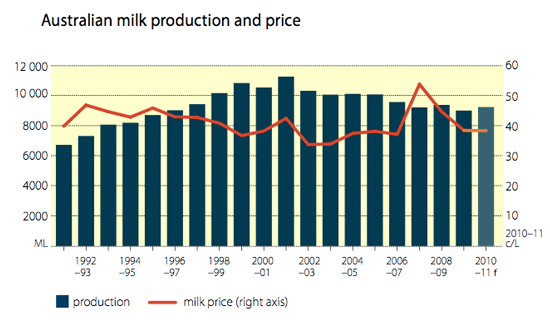
Australian farm-gate milk prices are forecast to rise by 3.2 per cent in 2010–11 to average 38.5 cents a litre, as a result of a continued recovery in global demand for dairy products.Australian milk production
Opening prices for manufacturing milk set by dairy processors in Victoria for the 2010–11 season averaged around 34 cents a litre. This is well above the opening price of 26 cents a litre for the 2009–10 season.
Australian milk production is forecast to rise by 2.6 per cent in 2010–11 to 9250 million litres in response to higher farm-gate milk prices and higher per cow yields as a result of favourable seasonal conditions. The capacity of the Australian dairy industry to increase milk production is strongly linked to seasonal conditions, the availability of water for irrigation and the cost of feeds. Above average autumn and winter rains in 2010 were received in the main dairying regions of south-east Australia and, given the seasonal outlook for spring, there is expected to be favourable spring and early summer pasture growth. For irrigation-dependent farms in the Murray–Darling Basin, water levels in the main storage dams have improved considerably and water availability is expected to be well above that of recent years. The price of traded water has also declined, reducing the cost of water purchased by irrigators. With purchased grain and concentrates accounting for around one-third of the cash costs of dairy farmers, forecast higher domestic feed grain prices in 2010–11 have the potential to constrain milk yield increases and temper the expected rise in milk production.
Australian dairy export earnings to increase in 2010–11
The value of Australian dairy product exports is forecast to increase by 8 per cent in 2010–11 to $2.23 billion. The value of butter and cheese exports is forecast to increase by 17 per cent and 8 per cent to $248 million and $772 million, respectively. The export values of skim milk powder and whole milk powder are forecast to be $404 million and $311 million in 2010–11, 13 per cent and 5 per cent higher, respectively, than in 2009–10.

| Dairy outlook | |||||
|---|---|---|---|---|---|
| 2008 - 09 | 2009 - 10 S | 2010 - 11 F | % Change | ||
| Cow numbers | 000 | 1676 | 1630 | 1630 | 0.0 |
| Milk yields | L/cow | 5602 | 5531 | 5675 | 2.6 |
| Production | |||||
| Total Milk | ML | 9388 | 9016 | 9250 | 2.6 |
| -- Market Sales | ML | 2229 | 2269 | 2310 | 1.8 |
| -- Manufacturing | ML | 7159 | 6747 | 6940 | 2.9 |
| Butter | kt | 148 | 128 | 133 | 3.9 |
| Cheese | kt | 343 | 345 | 354 | 2.6 |
| Whole Milk Powder | kt | 148 | 126 | 127 | 0.8 |
| Skim Milk Powder | kt | 212 | 190 | 198 | 4.2 |
| Farm-gate milk price | Ac/L | 42.5 | 37.3 | 38.5 | 3.2 |
| Value of exports | A$m | 2679 | 2066 | 2231 | 8.0 |
| World Prices | |||||
| Butter | US$/t | 2485 | 3477 | 3700 | 6.4 |
| Cheese | US$/t | 3281 | 3748 | 3880 | 3.5 |
| Skim milk powder | US$/t | 2333 | 2948 | 3072 | 4.2 |
| Whole milk powder | US$/t | 2546 | 3221 | 3350 | 4.0 |


