US dairy herd expands as milk output climbs 3.4%
July exports hit record high on strong cheese, butter demand
 8 October 2025
 2 minute read
 By:
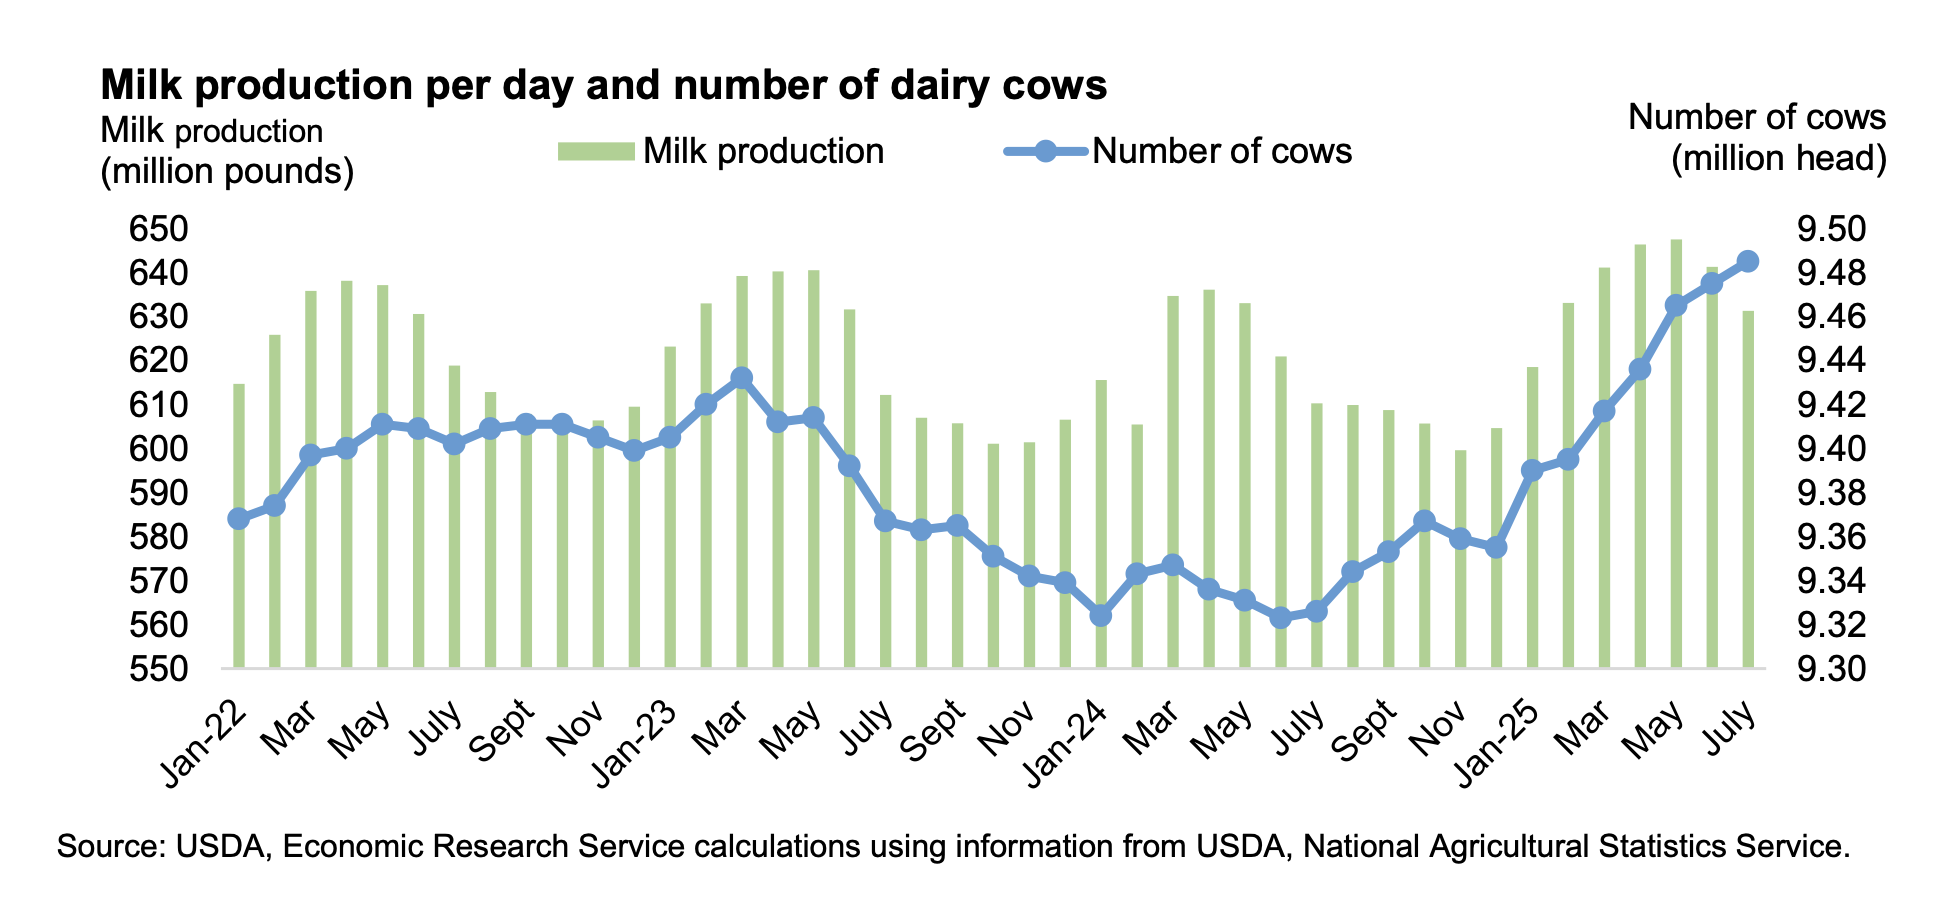
By: Despite low replacement heifer availability, the dairy herd has continued its expansion in 2025, according to the US Department of Agriculture's Livestock, Dairy, and Poultry Outlook for September. The national herd has continued to grow, with no signs of contraction since January 2025.
According to the USDA’s National Agricultural Statistics Service (NASS), US milk production totalled 19.570 billion pounds in July 2025—an average of 631 million pounds per day— representing a 3.4% increase over July 2024. Milk cows on farms averaged 9.485 million head in July, up 159,000 head from the same month last year and 10,000 head above the previous month. The average milk production per cow was 2,063 pounds, up 34 pounds from July 2024.
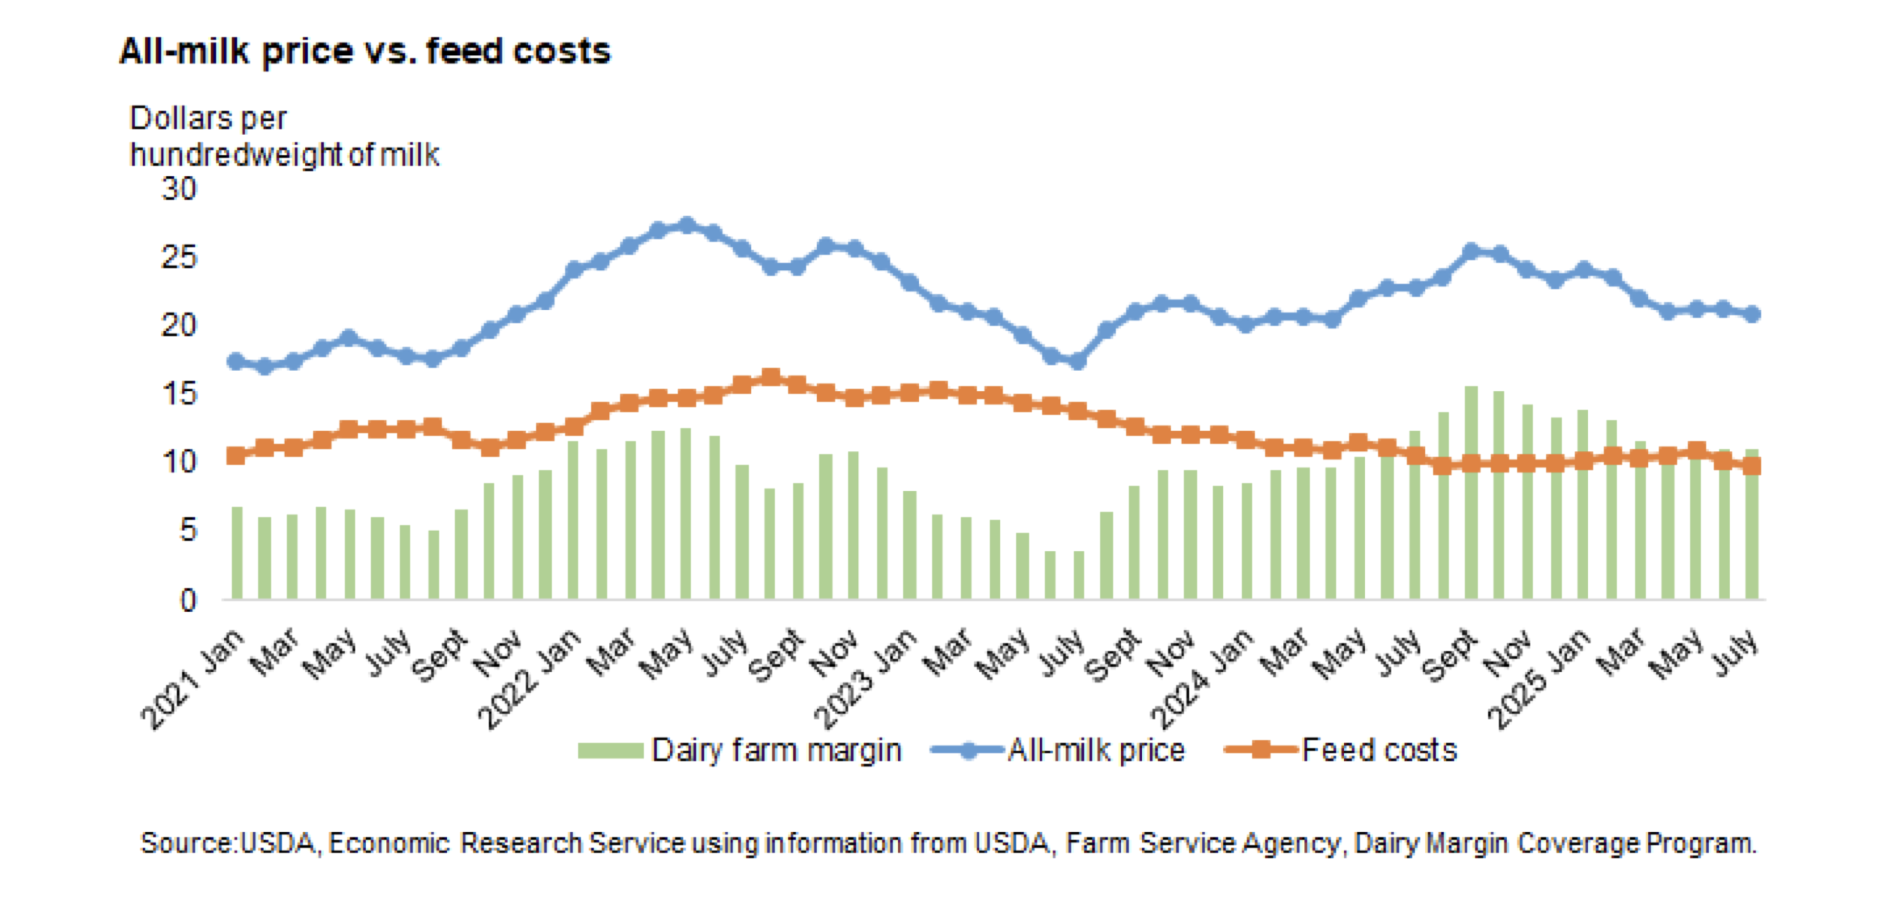
In July, the Dairy Margin Coverage (DMC) program reported a farm milk margin above feed costs of $10.94 per hundredweight (cwt). The margin was $1.39 per cwt lower compared to July 2024, driven by a decline in all-milk price that offset declines in feed costs.
US dairy exports on a milk-equivalent (m.e.) milk-fat basis reached a record high for any month, totaling 1,602 million pounds, an increase of 556 million pounds (+53.2%) from July 2024. On a milk-equivalent skim solids basis, July exports totalled 4,353 million pounds, up 1.8% compared to July 2024. Notable year-over-year increases in July 2025 exports included cheese, butter, dry whey products, and lactose, while skim milk products experienced notable declines.
Over the past decade, dry skim milk products4 has led US dairy exports, consistently exhibiting higher volumes than other products. However, in recent years, after reaching a record high in May 2021, dry skim milk products exports have been on a general downward trend. In contrast, cheese exports have shown a steady and significant increase, especially in 2025, narrowing the gap with dry skim milk products exports. Mexico remains the main destination for cheese and dry skim milk products. Dry whey exports have followed a flat trend over the past decade, despite periodic fluctuations. China and Canada remain the primary destinations for US dry whey. Butter exports have consistently been the lowest among these selected products in terms of volume, yet they more than doubled from January to July 2025 compared to previous years— partly due international competitive pricing and increased demand from Canada.
US dairy exports volumes, measured on a skim-solids basis, have consistently exceeded those on a milk-fat basis over the past decade, reflecting the dominance of dry skim milk products in total export volume. However, the increase in cheese exports—contributing significantly to both milk-equivalent measures—has also shaped this trajectory. In more recent years, particularly 2025, exports on a milk-fat basis have shown a noticeable upward trend, driven by record-high cheese exports as well as those of butter and other products with relatively high milk-fat content.
Imports of dairy products declined in July 2025 compared to the same month in 2024, primarily due to reduced imports of cheese, butter, and infant formula. In July, imports on a milk-fat basis totaled 606 million pounds, down 201 million pounds from July 2024. On a skim-solids basis, July imports were 575 million pounds, 8 million pounds lower than the same month last year.
During the 3-month period from May through July, domestic use totaled 55.4 billion pounds on a milk-fat basis and 47.9 billion pounds on a skim-solids basis, representing a 0.7% decrease and a 3.7 percent increase, respectively, compared to the same period in 2024. Notable increases in domestic utilization during this period were observed for dry skim milk products, dry whey, whey protein concentrate, and lactose, while cheese and butter experienced declines.