In The Cattle Markets - Cattle Inventory Down
US - A weekly review of the cattle market by Darrell R. Mark, Ph.D., Associate Professor. 4 February 2009
 5 minute read
Cattle Inventory At 50 Year Low
Last Friday, USDA released its semi-annual cattle inventory report. Most analysts and traders expected declines in most inventory categories of about 1 per cent. USDA’s reported numbers last week were generally below pre-release estimates, and were much lower than expected given downward revisions in last year’s inventory numbers.
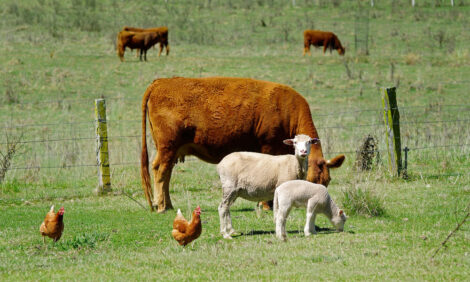
USDA estimated the total number of cattle and calves in the U.S. on January 1, 2009 was 94.491 million head, 1.6 per cent lower than January 1, 2008 (which was revised downward by 634,000 head to 96.035 million head). Thus, total inventory was down 2.2 per cent compared to last year’s reported number. The number of all cattle and calves has not been this small since 1959. This inventory estimate also confirmed that the liquidation phase of the relatively short current cattle cycle (which began in 2004) is accelerating. During 2007, the first year of liquidation, total inventories dropped by less than 1 per cent, but last year’s decline of 1.6 per cent seems to confirm that the industry is contracting.
The decrease in inventory numbers was led by drops in beef cow, calf, and cattle on feed numbers while dairy inventory numbers were up slightly. At 31.671 million head, the beef cow inventory on January 1, 2009 was down 2.4 per cent from last year (which was revised downward by 118,000 head) and the smallest beef cow herd since 1963. Beef heifer retention was estimated at 5.526 million head, 2.2 per cent less than the previous year. Of the ten states with the largest beef cow herds, only four saw increased heifer retention compared to last year (Florida +3.7 per cent, Missouri +6.6 per cent, Nebraska +6.6 per cent, and Texas +5.3 per cent). While slower than last year’s beef heifer retention rate, the decline in heifers held back during 2008 points to smaller calf crops over the next few years. USDA’s estimate of the 2008 calf crop at 36.113 was 1.8 per cent smaller than 2007 (which was revised down by 760,000 head, so the calf crop was nearly 4 per cent smaller than the previously reported estimate for 2007). This yearly calf crop is the smallest since 1951. From the supply side (i.e., ignoring demand issues), this should be supportive to calf prices for the next several years.
USDA’s semi-annual cattle inventory report provides an estimate of all cattle on feed (regardless of feedyard size) to augment its monthly cattle on feed report that surveys only feedyards with more than 1,000 head capacities. USDA reported that there were 13.851 million head of cattle on feed in all feedyards on January 1, 2009, 6.6 per cent less than one year ago. In the January cattle on feed report released the previous week, USDA reported the number of cattle on feed in feedyards with more than 1,000 head capacities was down 7.1 per cent at 11.234 million head. Thus, the estimated number of cattle being fed by smaller-sized feedyards declined only about 4 per cent. This is the second year in a row where the number of cattle on feed in small feedyards either declined less or grew more than that of the 1,000+ head capacity feedyards. Perhaps this points to growth in the number of smaller-sized feedyards (information that will be available in the February 2009 Cattle on Feed report) as cattle feeding has shifted somewhat towards the Northern Plains in recent years as a result of high corn prices and co-product availability.
Overall, the Cattle Inventory Report should be viewed fairly bullishly – in the short run because declines were larger than expected and in the long run because inventory levels are very tight (smallest in recent history). The big challenge for the cattle and beef markets will be on the demand side as the U.S. and global economic worries and recession continue.
January 1 Total Cattle Inventory
U.S., Annual
The Markets
The slaughter cattle market suffered last week from negative economic news and struggling beef demand. Dressed prices in Nebraska dropped nearly $2.50/cwt while live weight prices in Kansas declined by almost $1.75/cwt. Choice boxed beef prices seemed to lead the way for a lower market and averaged $5.51/cwt lower last week. Noting the drop in fed cattle prices, feeder cattle prices generally were about $2/cwt lower in Nebraska and Kansas last week. Through Thursday last week, corn prices, basis Omaha, NE, were off a nickel, but distillers grain prices have continued to rally against corn prices and are now about 109 per cent of the corn price on a dry matter basis.
| Week of 1/30/09 | Week of 01/23/09 | Week of 02/01/08 | |
|---|---|---|---|
| Kansas Fed Steer Price, live weight | $80.14 | $81.92 | $89.89 |
| Nebraska Fed Steer Price, dressed weight | $129.64 | $132.06 | $143.64 |
| 700-800 lb. Feeder Steer Price, KS 3 market average | $92.94 | $94.20 | $100.91 |
| 500-600 lb. Feeder Steer Price, KS 3 market average | $112.94 | $112.13 | $118.74 |
| 700-800 lb. Feeder Steer Price, NE 7 market average | $94.83 | $96.52 | $103.50 |
| 500-600 lb. Feeder Steer Price, NE 7 market average | $116.26 | $118.15 | $123.51 |
| Choice Boxed Beef Price, 600-900 lb. carcass | $145.47 | $150.98 | $143.44 |
| Choice-Select Spread, 600-900 lb. carcass | $4.36 | $6.49 | $6.04 |
| Corn Price, Omaha, NE, $/bu (Thursday quote) | $3.68 | $3.73 | $4.76 |
| DDG Wholesale Price, Iowa, $/ton | $127.50 | $125.00 | $177.50 |