

Using Reproductive Records: Basics of Monitoring
Sound reproductive management can have tremendous positive effects on profitability and one of the key components of modern dairy production medicine is the analysis of reproductive records, says Michael W. Overton, College of Veterinary Medicine, Department of Population Health, University of Georgia, Athens.Accurate and reliable on-farm records can help guide producers, veterinarians, and consultants to make better management decisions regarding reproductive management. The majority of cows in the US dairy herd are managed using some form of computerised records system such as DairyComp 305, PCDart, and DHIPlus. Carefully maintained and accurate records that can be analysed appropriately can help answer questions such as: 1) Where are we now regarding pregnancy production? 2) How have we performed historically? and 3) Where are we headed in the near future?
Evaluating Reproductive Performance
Every dairy consultant has their own approach toward evaluating reproductive performance via dairy herd records. The approach that is presented here is not meant to be all inclusive, nor is it meant to be an “ideal” method, but rather is simply the approach that the author prefers to take when looking at reproductive records on-farm. Illustrations will be made using a combination of PCDart (and Dairy Herd Detective) and DairyComp 305 software graphs and reports. The following outline represents one potential approach to the evaluation of reproductive performance. Unfortunately, it is beyond the scope of this paper to cover each of the following points or to delve into significant details for each topic.
- Understand the herd's objectives regarding its reproductive programme
- Verify completeness of the available data
- Evaluate the 'true' voluntary waiting period (VWP) (for most dairies, this is 45-60 days in milk) and the herd’s ability to deliver semen in a timely manner for first insemination
- Evaluate the pregnancy rate, ideally from a variety of ways:
- Whole herd performance over the last year (by calendar date or by days in milk)
- Artificially inseminate (AI) herd vs. natural service (if bulls are used)
- First lactation vs. 2+ lactation cows - Evaluate insemination risk using the previous approach (except for bulls)
- Evaluate conception risk
- Service number, breeding type or code, technician, day of the week, and via a stratified approach if cow numbers and software system allow - Pregnancy check evaluation – frequency, compliance
- Pregnancy hard count
- Pregnancy losses
- Transition health and management (if data is available)
The first step mentioned in the outline (evaluate the herd’s objectives) sounds a bit like an academic issue, but is critical in order to understand the herd’s goals, expectations, and willingness to work to improve. Reproductive performance goals and expectations vary, some producers want the highest possible pregancy rates from AI, while others don’t want to do anything more than deliver 1-2 AI services prior to dumping cows into bull pens. These latter herds do not want to be bothered with the intricacies of managing a timed AI programme or investing additional management time or resources.
Once it is determined that you and the producer are on the same page in terms of the herd’s reproductive performance goals and expectations, the next step is to verify the completeness of the data. Screening data for accuracy and completeness may involve reviewing lists of cows, examining histograms or scatter graphs, or by evaluating summary tables.Some key items to consider:
- Are there at least 365 days worth of culled cow records available?,
- Has the recent insemination and pregnancy confirmation information been recorded?,
- Are AI and bull pens individually and accurately defined?,
- Are the records under consideration limited to only the herd of interest? (i.e., are we actually looking at two herds sharing the same data file?), and
- Have there been any new cows merged into the database recently?
Prior to examining the herd’s pregnancy rate, one must determine what the true voluntary waiting period is for the herd in order to know when to start “counting”. Many herds will state that their voluntary waiting period is “60 days”, but in reality, the records show something entirely different. One approach would be to create either a scatter plot or, as shown below in figures 1 and 2, frequency histogram of days to first insemination.
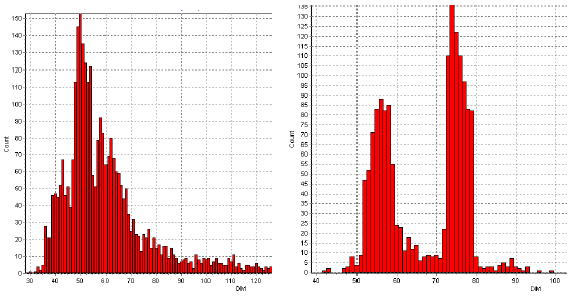
Comparing the two figures above, it is clearly evident that herd “A” is breeding cows earlier than herd “B” and that herd “B” appears to be utilising some form of synchronisation protocol based on the pattern of first insemination. The true VWP for herd “A” is ~ 40 days (four per cent of cows have been inseminated by 40 days in milk) while in herd “B”, the VWP is ~ 51 days.
As useful as these histograms are, they have lots of momentum within the data that is displayed since they typically display the results of the past 12 months. An alternative approach would be to use a scatter graph of DIM at first breeding by calendar date. This will show both the pattern and whether the VWP has changed over time. Figure 3 is an example of this approach for a southeastern herd. Notice the consistency across time and how this herd has excellent control over first service.
Figure 3. DIM at first insemination by calving date.
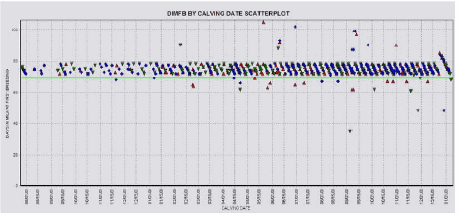
Once the true VWP has been established, one can then dig deeper to evaluate the efficiency of delivering the first insemination, either by visual assessment of graphs or by calculation using other commands. In AI herds, I like to determine what percent of cows receive an insemination within a specified period of time following the true VWP. For example, if a herd is using total timed AI on a weekly basis and a VWP of 70 days, I would like to see 90-95 per cent of cows that are 81 DIM or greater with a first insemination between 70 and 77, excluding reproductive culls and cows starting a lactation by abortion. (For herds using TAI every 2 weeks, the window is expanded to 14 days instead of 7.) Referring back to figure 3 again, this herd is doing an excellent job as they have 95 per cent of all cows serviced within a 7-day window of their voluntary waiting period.
On the contrary, examine figure 4 below that illustrates the problems that herds can have when they rely on a poorly run estrus detection programme. Cows are inseminated too early and it takes a long time (too much variation) for cows to be inseminated.
Figure 4. Example of a herd with poor control of first insemination.
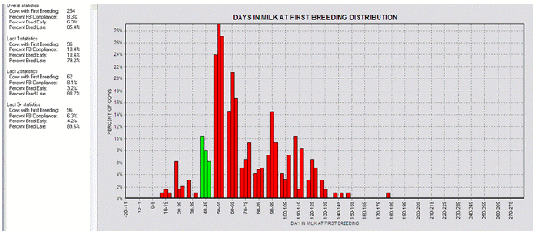
However, most herds do not utilise total TAI and thus expectations must be modified. In the herd pictured in figure 2, a back-door TAI is utilised after breeding off of heats induced by the second prostaglandin in a Presync programme on a weekly schedule. The first major band represents cows bred off of standing heat and the second, taller band represents cows receiving the TAI. In between are the cows that either failed to synchronise or were incorrectly inseminated too early. In this situation, if a herd is enrolling cows on a weekly basis, I like to see 90-95 per cent of cows inseminated within 30 days of the VWP (51+30=81), excluding “do not breed” cows and cows starting lactation by abortion. In this herd’s case, it is performing quite well at 93 per cent.
Once the VWP and efficiency for first service has been evaluated, I like to look at the pregnancy rate. While no single monitor is perfect, I feel that pregnancy rate, when performed correctly, is the single best tool for assessing both historical and ongoing reproductive efficiency in a dairy herd. Pregnancy rate is a metric that evaluates the speed at which cows become pregnant and is calculated most commonly on a 21-d basis by dividing the number of cows that became pregnant during a specific 21-d period by the number of cows considered eligible to become pregnant over the same time period. To be considered eligible during that specific 21-day cycle, cows must be past the VWP, not classified as a “do not breed” cow, not already pregnant, and not pending some unknown outcome. Eligibility does not refer to whether an animal is cycling or not.
I typically start my evaluation of pregnancy rate by calculating the pregnancy rate over the recent past few months, using the estimated voluntary waiting period as calculated above. When working with DC305, I like to look at the preg rate for AI only, bull only, and the combined preg rate. When working with PCDart herds, currently, we are limited to only looking at the whole herd all together.
In general, a reasonable pregnancy rate goal should be to get the herd’s cumulative, annualised pregnancy into the mid 20’s. At 24 to 25 per cent pregnancy rate, most of the value to be derived from reproductive performance has been achieved. However, a word of caution is in order here. For herds that delay breeding to 70-80 or more DIM, the calculated pregnancy rate must be significantly higher at this later starting point in order to generate a similar number of pregnancies as a similar herd that starts breeding a 50-60 DIM. For example, in this herd with a 21-22 per cent cumulative average pregnancy rate, approximately 485 pregnancies are generated over this time span. If this herd had maintained the same cycle-specific performance for cycles starting at 73 DIM, but added an additional cycle of breeding prior to this level with an average pregnancy rate of 15-17 per cent, the calculated pregnancy rate would be approximately 20 per cent, but an additional 10-15 pregnancies could have been generated.
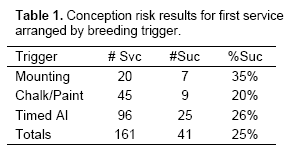
Following an examination of pregnancy rate, one should look at conception risk information. PCDart has several alternatives for examining conception risk (reports # 094 and 106). I will not go into full detail on evaluation of conception risk, but rather will illustrate a few concepts using the results shown in Table 1.
Table 1 displays the first service conception risk information from a southeastern herd. Statistically speaking, there are not enough numbers to confidently state that the conception risk results between the three breeding triggers are different. There are many potential confounders that might impact the conception risk results of each of the three recorded breeding codes such as AI technicians, season of the year, lactation number for cows in each group, etc. However, if we assume that the trends represent the general pattern of results and only 1 technician was involved, one possible interpretation might be that 1) it appears that if cows are accurately detected in heat, semen can be delivered successfully as evidenced by the 35 per cent conception risk for mounting cows, 2) inaccurate heat detection might be leading to conception risk issues (as evidenced by the lowest conception risk in the chalk/ paint category), and 3) either compliance issues or possibly cyclicity challenges are most likely impacting the timed AI conception risk results. Again, I must emphasise that there are not enough numbers in this very small data set to make any certain conclusions, but this illustration merely shows one approach or way of thinking in terms of evaluating conception risk results.
In many herds in the US, there are often insufficient numbers of inseminations to adequately and correctly draw statistically correct conclusions about conception risk once it is stratified by lactation, times bred, technician, etc. I have heard stories of dairy managers changing insemination technicians based on a 7-8 per cent difference in apparent conception risk. Statistically speaking, in order to have full confidence (95 per cent confidence interval) that the differences are indeed real, there must be ~ 750 cows per breeding group in order to confidently say that 42 per cent CR by technician 1 is indeed different than the 35 per cent CR by technician 2. Also, make sure that if sufficient numbers are available, that you are comparing apples to apples and not apples to oranges. For example, if I want to compare the performance of the aforementioned technicians, I must make sure that they are actually breeding the same types of cows (first lactation, for example) and that one is not cherry picking certain cows. How many herds do you know that have enough first lactation animals that are bred for the first time during the summer heat stress period to make up two groups of 750+ animals each? In reality, this is very difficult to achieve, and while few herds are interested in the 95 per cent confidence interval prior to making a change, the point is made that caution should be observed prior to firing someone that may in fact be doing a reasonable job.
Also, if a new technician is hired, there must be sufficient time elapsed before an evaluation is possible. Conception risk is determined using inseminations with known outcomes. Whenever a new technician starts, his or her early conception risk numbers are biased downward since you gain information about negative outcomes (conception failure) earlier via cows returning to heat than positive outcomes (pregnancies) due to differences in the lag time for outcome determination.
An alternative reproductive monitoring approach that has gained in popularity is the concept of pregnancy hard counts or pregnancy inventory. The basis for this approach is that in order for a herd to maintain itself in cow numbers, a minimum number of pregnancies (and therefore future calvings) per month is necessary to replace cows that are culled, sold, or that may die. For most non-seasonal, stable herds (not expanding or contracting in size) with typical culling risks, approximately 10 per cent of the lactating herd should calve each month. This estimate can be derived by dividing the total cow herd inventory (milking and dry) by the actual calving interval. For example, in a herd with 1600 total cows and a 13.5 actual calving interval, ~ 120 calvings per month are needed. In order to end up with 120 calvings, we must account for the culling of pregnant cows and the pregnancy loss. If 10 per cent of pregnancies are lost to abortion and 2 per cent of pregnant cows are culled, we must adjust by a total of about 12 per cent. In this case, 120/ (1-.12) = 136 pregnancies must be created per month, including heifer replacements and lactating cows. If the culling risk for the lactating herd is 33 per cent, then the herd must provide 33 per cent of the pregnancies by heifer replacements and the rest by the milking cow herd, resulting in approximately 91 pregnancies needed from the cow herd per month to maintain a stable herd size, or about 21 pregnancies per week. In order to create 21 pregnancies per week in a herd with a conception risk of 30 per cent, about 70 cows should be inseminated per week. Some farms have found that pregnancy hard counts used in this manner may be beneficial as a longer term goal to help address the roller coaster calving patterns that are often present (and the resulting strain that these patterns may place on transition cow facilities and management).
In much of the southeast, summer heat stress conditions preclude herds from maintaining a consistent flow of pregnancies. To account for this issue, the above example must be modified to consider approximately 8 months of time at risk to generate the same number of pregnancies. Therefore, we need about 50 per cent more pregnancies per month over the limited breeding period of 8 months as would be needed if pregnancies could be consistently produced over the full 12 month period of time.
Unfortunately, there are a number of weaknesses with this approach. First, it does not consider the number of eligible cows. It is rare to find a herd with a stable number of non-pregnant cows year-round. Second, it sometimes provides inseminators the assumption that we must breed “X” number of cows this week, irrespective of the population at risk for breeding. Third, this number ignores the impact of early pregnancy diagnosis and pregnancy wastage. Pregnancy rate is better for day-to-day monitoring of performance with the pregnancy hard count approach being a useful evaluation to help forecast any potential holes in the projected calving inventory.
Another facet of reproductive management that must not be forgotten is the problem of pregnancy wastage and its potential impact on reproductive efficiency. Pregnancies that are lost prior to ~ day 40 post-breeding are termed embryonic loss and losses that occur after day 40 are termed abortions. A herd’s apparent conception risk can look better or worse depending upon how early pregnancy diagnosis is conducted. For herds utilising ultrasound and recording early pregnancy outcomes, the apparent conception risk (and pregnancy rates and counts) as well as risk of pregnancy loss could potentially be falsely elevated depending upon how these early results are handled by the software programme and by the nomenclature used by the farm. Perhaps we should only utilise early exams with ultrasound or blood testing as “open” cow checks and reserve the pregnancy check for closer to 40 days post-breeding.
Monitoring dairy herd reproductive performance need not be a complicated, daunting task, but a little preparation can ensure that the correct performance indicators are used correctly. Of course, this may mean changing the monitoring parameters that have been used in the past. Short (low) calving intervals and reduced days-open are legitimate goals for dairies, but these outcomes should not be used as key monitoring parameters due to the previously mentioned problems such as lag, momentum, bias and variation. Instead, focus on a few key areas such as first service insemination efficiency, reinsemination of non-pregnant cows in a timely manner, optimising rather than maximising conception risk, and transitioning cows in a healthy manner. With an eye on these key areas, carefully maintained and accurate records that can be analysed appropriately can determine historical reproductive performance, current status of pregnancy generation, and may help give some guidance to where the dairy is headed in the near future. Although there is no one perfect reproductive parameter, whole herd pregnancy rate, when calculated and used correctly, provides the most information regarding overall performance and should be the basis for evaluating dairy herd reproductive efficiency.
Further Reading
| - | You can view the full report by clicking here. |
December 2009

