Prospects for Dairy Markets, Prices and Income 2013-2023
European Commission analysts see a positive outlook for both world and domestic dairy markets and deliveries are expected to reach 150 million tonnes by 2023. 18 February 2014
 5 minute read
- Quotas are being lifted but environmental constraints in certain regions will limit growth.
- Production expansion will come from EU-15 nations having cow yields of 8,500 kg/cow and EU-13 having yields of 6,050 kg/cow.
- Cheese demand is expected to surge - EU production predicted to be 10.7 million tonnes in 2023.
- Butter will stabilise from 2015 onwards at 2.3 million tonnes.
- Exports will drive skimmed milk powder to 1.25 tonnes.
Milk production development 2014/15 is the last year of the quota system and will not see the 1 per cent quota increasethat has applied in previous years. Nonetheless, compared to the slow start of 2013, milk deliveries should increase already significantly in 2014 (+1.3 per cent ), driven by lower feed costs and firm (though not higher) milk prices.
Till the end of the quota-system, production increase will be constrained by the quota in certain member States, leading to the increase in milk quota prices observed in Denmark, Germany and the Netherlands, where deliveries increased sharply in 2013 further to the milk price increase.
While the increase in production should continue in 2015 (+1.6 per cent ), a big jump in milk deliveries is not expected.
Part of the increase resulting from the lifting of quotas is expected to have already fed through the year before. Also, in Member States where the quota was in any case significantly underutilised, there is no reason to expect a strong reaction to its abolition.
Bigger increases can be expected in those currently restricted by the quota (e.g. the Netherlands, Denmark,Germany, Austria and Cyprus).
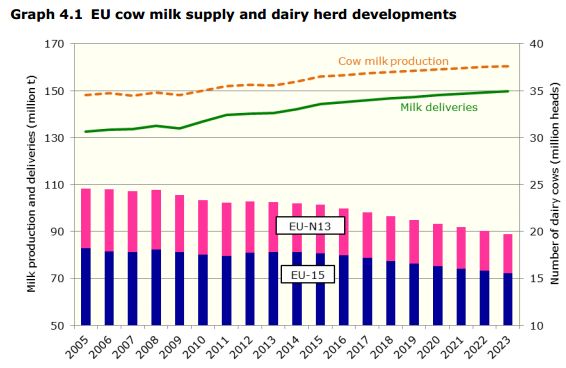
After 2015, milk deliveries are expected to increase further, but at a slower pace, to reach 150 million tonnes in 2023 (Graph 4.1), i.e. 9.6 million tonnes more than in 2012. Most of the growth will take place in the EU-15; the EU-N13 could produce an additional 1.2 million tonnes. (The potential change in milk deliveries at Member State level is analysed in Chapter 10.)
By the end of the projection period, the annual increases in milk deliveries are expected to slow down because of narrower operating margins.
Given the strong world demand for dairy commodities and feed price projections 15 per cent below 2010-12 levels, the nominal EU price should be quite stable, but steady increases in other operating costs (especially for energy) are likely to squeeze margins. In addition, environmental constraints will limit production expansion in some Member States (see Chapter 10).
Over the projection period, the production of milk for own consumption and on-farm processing (including that from subsistence farming in Romania and Bulgaria) is expected to fall off slightly faster than in the past decade in the EU-N13, while remaining stable in the EU-15. A slower declining trend in direct sales is assumed, while slightly less milk might be used to feed animals. Feed use depends a lot on the milk price: the higher the price the lower the feed use. As a consequence, the delivery rate should increase, reaching 93.4 per cent by 2023.
Higher Yields and Fewer Dairy Cows
The projected production increase will come from further yield improvements to 8 500 kg/cow in the EU-15 in 2023 and 6 050 kg/cow in the EU-N13, where the average yield is expected to grow by 2.7 per cent a year. This growth, which is much faster than that in the previous decade (+1.1 per cent ), is linked to the fact that less of the production will take place in Romania and Bulgaria where yields are low (3 340 kg/cow and 3 710 kg/cow in 2012 respectively) and the significant remaining scope for improving productivity.
In the EU-15, the trend is also expected to accelerate slightly, as production becomes more concentrated in the most productive countries (the exception is Ireland, where the average yield is lower because of the higher proportion of grass-based production, though it could increase significantly if farmers use more compound feed).
In 2012, according to Eurostat’s livestock survey, the number of dairy cows increased for the first time after 20 years of continuous decline. This decline was the result of the presence of milk quotas, which restricted milk production expansion, and the continuous increase in yields.
While the apparent increase is particularly marked in Italy, due to a statistical adjustment without correction of the historical figures, the number of dairy cows is higher or stable in several other main producing countries, e.g. Spain, the Netherlands, the UK, Luxembourg and Ireland. However, this is not expected to reverse the trend, as EU dairy cow numbers should start to fall again as from 2013. Annual decreases could be small initially, but reach -1.9 per cent by the end of the projection period.
Dairy Products
The additional milk goes mainly into cheese consumption and exports
It is expected that the cheese sector will be buoyed by a dynamic world market and steady growth in domestic demand. In the EU-15, it seems that the cheese market is not yet saturated, but per capita consumption is expected to grow more slowly than in the last decade, at 0.4 per cent a year (0.2 percentage points less than in 2000-12). Faster growth (2.2 per cent a year) is expected in the EU-N13, where per capita consumption (12.0 kg in 2012) is comparative low; here, it could reach 15.3 kg by 2023, as against 19.8 kg in the EU-15.
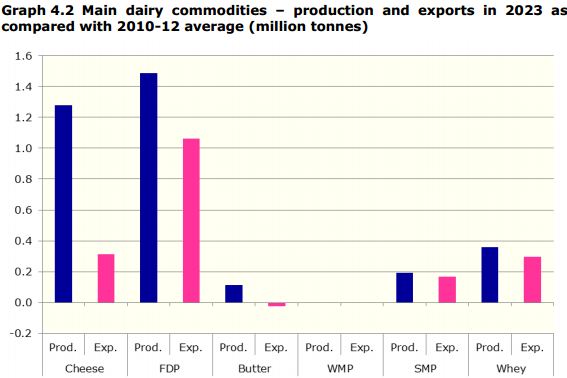
Cheese production is therefore expected to absorb most of the additional milk delivered to dairies, with production projected at 10.7 million tonnes by 2023, with exports close to 1 million tonnes and imports remaining very low, at around 75 000 tonnes (Graph 4.2). This represents 1.1 per cent annual growth in production over the projection period, i.e. somewhat less than the 1.6 per cent rise over the past decade.
Whey powder is in high demand for use mainly as a specific nutrient, in infant formula and in sports drinks. Market projections are very positive especially for exports, which could grow by 3.9 per cent a year - and production is expected to increase by 1.5 per cent annually.
By 2023, the production of fresh dairy products is expected to have increased by 3 per cent as compared with 2012 to reach 48.3 million tonnes. As illustrated above (Graph 4.2) exports are developing positively. As regards domestic consumption, perhaps surprisingly given its high fat content, cream for cooking is a particularly dynamic segment. The EU-15 yoghurt consumption is already very high but in the EU-N13 it could increase significantly. More generally, the current gap of over 50 kg in per capita consumption of FDP is expected to decrease by close to 10 kg between EU-15 and EU-N13 mainly due to increased consumption in the latter.
For butter, no clear market trends are discernible from recent years; after several years of decline, production and consumption stabilised in 2007 and started to increase in 2010 along with the higher milk production (Graph 4.3). Further growth is expected in 2014 because of the good market conditions in 2013. Production is expected to stabilise from 2015 onwards, at 2.3 million tonnes, as operators prefer to use dairy fat for cheese (also, the fat content of cheese is expected to rise), reducing availability for butter processing. Following high estimated levels in 2013, per capita consumption is projected to fall slightly, to 4.28 kg, by 2023.