Feeding Low Crude Protein Diets to Improve Efficiency of Nitrogen Use
In this study led by M.D Hanigan at the Department of Animal Science at Virginia Tech, ways of feeding cattle protein to reduce Nitrogen pollution is explored. 25 February 2014
 29 minute read
The dairy industry is coming under increased pressure from federal and local governments and from public opinion to reduce its environmental impact. Among the pollutants, nitrogen (N) excretion is a major concern. Ammonia N released from manure during storage and land application combines with sulfur dioxide and nitrogen oxides in the air to form very small particles (less than 2.5 ¬m).
These particles cause haze and contribute to lung problems and asthma in humans.
- If manure is over-applied or applied to frozen or sloped land, N can migrate into surface waters and contribute to eutrophication, which can ultimately cause degradation of aquatic ecosystems and coastal hypoxia.
- Within the soil, manure N is converted to nitrate, nitrite, and nitrous oxide.
- The former 2 can migrate into aquifers causing blood oxygen exchange problems in infants (methemoglobinemia).
- Nitrous oxide can escape to the atmosphere contributing to decreased stratospheric ozone concentrations and greenhouse warming. In the latter case, it has greater than 300 times the greenhouse gas effect of carbon dioxide.
- Nitrogen oxide, nitrogen dioxide, and sulfur dioxide (derived from the sulfur containing amino acids in undigested protein) that escapes to the air creates acid when dissolved in raindrops causing acid rain, which increases the acidity of soil and surface water (Wolfe and Patz, 2002).
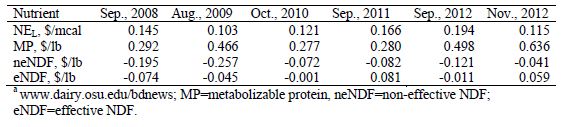
Protein, which is the source of the waste N and environmental pollution, is an expensive dietary nutrient (Table 1) representing approximately 42 per cent of the cost of a lactating cow ration (St-Pierre, 2012). The reduction of dietary protein levels could potentially result in decreased demand for high protein ingredients, reduced price of those ingredients, and the diversion of acreage to higher yielding crops such as corn instead of growing oilseeds. This would result in increased corn supply, which would cause a reduction in the cost of low protein ingredients as well.
Table 1. Nutrient values based on central Ohio ingredient prices. From ST-Pierre and Knapp .
In a survey carried out on 103 large scale dairies across the country (613 ± 46 cows; 34.5 ± 0.3 kg of milk per cow per day), nutritionists reported feeding diets with 17.8 ± 0.1 per cent crude protein (CP) (Caraviello et al., 2006). A meta-analysis of 846 experimental diets found a similar mean CP content and conversion efficiencies for dietary and metabolizable N (based on NRC, 2001) to milk protein of 24.6 per cent and 42.6 per cent, respectively (Hristov et al., 2004). Assuming the same dietary conditions (22.1 kg/d DMI and 17.8 per cent CP) over a 10 month lactation, the national herd of 9 million dairy cattle (Livestock, Dairy, and Poultry Outlook: August 2012, LDPM-218, Dairy Economic Research Service, USDA) would excrete 1.3 million metric tons (mmt) of N per year. If a dietary protein conversion efficiency of 35 per cent could be achieved with no change in milk protein output, excreted N would be reduced 39 per cent to 0.51 mmt.
Dietary protein is used to support microbial growth in the rumen. The combination of microbial protein flow from the rumen and ruminally undegraded dietary protein (RUP), which represents the majority of the metabolizable protein (MP) supply to the animal, is used for maintenance and >productive functions such as milk protein synthesis. Several models, such as the NRC Nutrient Requirement models (NRC, 1989; 2001), estimate ruminal and animal N requirements, supply of ruminally degradable protein (RDP) and RUP, and are used in ration balancing software. Because the NRC model is widely used, it is a primary determinant of protein use in dairy diets.
Provision of less RDP than required by the microbes or the animal will result in reduced milk protein yield although it will increase N efficiency. Increased N efficiency seems to be a positive effect.
However, increased N efficiency will not necessarily result in efficiency gains at the national level. If one considers that a given amount of milk is required to meet consumer demand, a loss in production per cow will require that additional cows be milked. The maintenance costs of those extra animals will quickly negate the apparent gains in efficiency per animal.
Feeding protein in excess of requirements results in the use of the surplus protein for energy needs, increased N excretion, and decreased animal efficiency (Kalscheur et al., 2006). Thus, it is important that animals be fed precisely at their requirements if maximal efficiency is to be achieved. The benefits of improved efficiency to the industry are reduced production costs associated with purchasing less dietary protein. The benefit to society is the reduced environmental impact of generating food, e.g. milk.
Ruminally Degradable Protein Requirements
Ruminally degradable protein supply and requirement predictions by the NRC model (2001) represent our best estimates of current nutritional knowledge. The degradation of dietary CP in the rumen is important as it supports microbial growth. Inadequate RDP leads to reduced ruminal ammonia concentrations, which causes a depression in microbial growth and flow to the small intestine. It also causes a reduction in fiber degradation (Firkins et al., 1986) and reduced DMI Allen, 2000).
However, the reduction in microbial flow does not always lead to a reduction in metabolizable protein available to the animal, as reductions in microbial N flow can be offset by increases in RUP flow (Santos et al., 1998). If dietary protein is not degraded in the rumen, it is able to bypass microbial activity and flow into the small intestine. Therefore, the loss in fiber digestion and intake is of greater significance as there is no capacity for fiber digestion in the small intestine and very little capacity in the large intestine. If ruminal fiber digestion is inhibited or dry matter >intake is reduced, the supply of energy to the animal will be reduced thereby reducing milk yield.
Evidence suggests that ruminants can remain productive at much lower N inputs than are currently recommended and used in practice (Christensen et al., 1994; Christensen et al., 1993). The RDP requirements for dairy cows generally range from 9.5 to 10.5 per cent of dietary DM depending on diet, animal characteristics, and production level. Recommendations for RDP in the NRC (2001) were >statistically derived from a large data set collected from literature. Although the resulting regression equation describes the data reasonably well (r2=0.52), few of the experiments used in the evaluation utilized RDP levels that were well below the current recommendation.
Thus, it is possible the current requirements are set too high because of inadequate range in the data used to derive them.
Results from research trials where the RDP: RUP ratio was changed while holding CP constant are difficult to interpret because the decreasing concentration of RDP is confounded with the increasing concentration of RUP. Gressley and Armentano (2007) observed no changes in milk production when 10.1 per cent and 7.4 per cent RDP diets were compared. Cyriac et al. (2008) observed no change in milk yield or DM intake when diets with 8.8 per cent RDP were fed, but did observe a significant reduction in intake and a trend for a reduction in milk yield when RDP concentrations of 7.7 per cent were fed (Table 2). In a subsequent study, using the 11.3 and 8.8 per cent RDP diets of Cyriac et al. (2008) in an experimental design with more power, Li et al. (2009) did observe a significant reduction in DM intake and a strong trend for a reduction in milk yield for cows given the 8.8 per cent RDP diet.
Table 2. Least squares means for intake, milk yield, and milk composition of dairy cows fed diets with constant RUP and varying RDP content. From Cyriac et al. (2008).
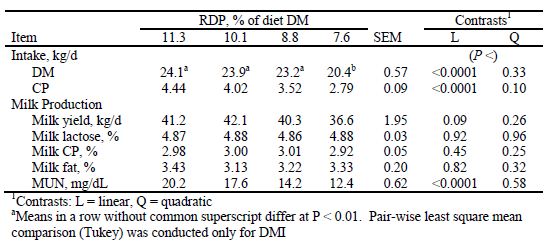
Thus, it would appear that RDP requirements may be greater than necessary and dietary RDP could safely be reduced to 9 per cent of DM or less under most conditions. However, there may be diversity among animals in their ability to tolerate lower RDP diets. Preliminary findings by Aguilar et al.(2011) showed that animals on a common diet and with similar milk yield vary in their transport of blood urea back into the rumen. Because this urea is an alternative source of ruminally degradable nitrogen, it is possible that animals with high transport activity may tolerate a lower dietary RDP content than those with low transport activity. However, this is preliminary work and needs to be extended before a final conclusion can be reached.
When deficiencies occur, they are almost universally associated with a drop in DM intake. Even though it is not currently clear what the diversity in cows may be, in terms of their tolerance for low RDP diets, some diversity among cows and thus among herds likely exists. If one wants to truly optimize the level of RDP feeding for each herd, then on-farm calibration should be adopted. Where multiple pens are fed a similar diet, one pen could be fed a lower RDP diet while the other pen is maintained at or above NRC requirements. If no change in DMI is observed after 10 days on the lower RDP diet, then one could adopt this as an estimate of the RDP requirements for that herd. Of course, given success with the first incremental reduction in RDP, additional reductions should be attempted assuming they make economic sense. Having established a herd specific requirement, this could be used for several years before requiring reassessment.
Metabolizable Protein Requirements
Although we commonly state animal N requirements in terms of MP, the true requirements are for the specific amino acids (AA) resident in that protein. Because there is diversity of AA composition in the absorbed protein, stating the requirements in MP units inherently forces a certain level of over-prediction of requirements to compensate for variation in AA composition of that protein. This is perhaps most apparent when feeding diets constructed largely from corn products which are inherently low in lysine. Such a diet could be created to meet MP requirements, but animals may still respond to the addition of a protected lysine source or more protein that also provides lysine to the ration. When these types of data are mixed with all other experiments in the literature and subjected to statistical analyses to derive MP requirements, the loss in production associated with a specific amino acid deficiency forces the statistical algorithm to solve to a higher MP requirement than would be necessary if the diet contained a perfect mix of amino acids. For example, pigs can achieve efficiencies of absorbed protein deposition in muscle protein of 85 per cent when fed a diet perfectly matched to their AA requirements (Baker, 1996) as compared to 42.6 per cent efficiency of conversion of MP to milk protein in lactating cows (Hristov et al., 2004). So, it is a given that MP requirements are greater than needed to compensate for variable AA supply. Thus, animals could successfully be fed a lower MP diet if the AA composition of that diet was better matched to AA requirements as demonstrated by Haque et al. (2012) using diets with less than 13 per cent CP. As the cost of RUP is 3-fold greater than the cost of RDP (Knapp, 2009), being able to reduce dietary RUP is of great economic interest.
Aside from the question of balancing for AA to achieve greater efficiency, there are additional problems with the NRC (2001) MP requirement equations. Obviously, one would expect the model to predict requirements at all levels of production with the same precision. For example, if the precision of the system at 60 lbs of milk/d is plus or minus 15 per cent, then one should expect similar precision at 80 and 90 lbs of milk. Unfortunately this is not the case. As demonstrated in Figure 4, the model over-predicts (predicted – observed; Should be 0 if all predictions were perfect) the amount of MP allowable milk at high levels of production and under-predicts at lower levels. Thus, when using the model, one may need to balance for slightly greater amounts of MP in the diet if working with high producing cows and the reverse when working with lower producing cows. As the MP supply predictions have been well validated, the problem appears to reside in the requirement equations.
Figure 4. Residual errors (Obs – Pred) associated with predictions of metabolizable protein (MP) allowable milk yields by the NRC (2001) model. Adapted from NRC (2001).
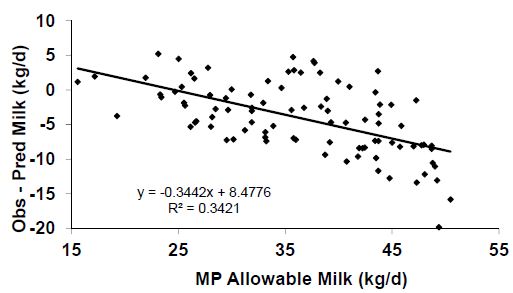
The problem with predicting MP requirements is at least partially driven by the model assumption that the conversion of MP to milk protein, after subtraction of maintenance use, is a constant 65 per cent. In a summary of literature data, Lapierre et al. (2007) found that the highest efficiency was 43 per cent and it declined from there as milk protein output (and MP supply) increased. Hanigan et al. (1998) summarized publications reporting responses to post-ruminally infused casein and found a similar maximal efficiency of conversion of about 45 per cent with an average conversion efficiency of 22 per cent. The reduction in efficiency at higher levels of production would seem to explain the over-predictions of allowable MP at those increased levels of milk yield. This problem is well recognized by our group, as well as others, and we are working to fix this problem. Such a fix will undoubtedly be in the next release of the NRC which is likely to occur in the next 4 to 5 years. However, in the mean time, one should be aware of the problem. When using the NRC model to balance a given ration at differing levels of dietary protein, one can assess the potential for saving money by removing all constraints from CP and relying on the model to solve for rations that meet RDP and MP requirements. Such an exercise is demonstrated in Error! Not a valid bookmark self-reference. with Eastern US ingredients at prevailing prices in 2011. From that work, it is apparent that diets can be formulated to meet NRC requirements down to at least 16 per cent CP, although the cheapest ration was at the highest level of protein. As protein costs increase relative to dietary energy costs, such low protein rations could become cost beneficial. Thus, it is important to allow the models to work without placing arbitrary limits on dietary protein content. Least cost rations, containing 16 per cent CP that still meet NRC requirements, can only be achieved if arbitrary minimums are not placed on dietary CP content.
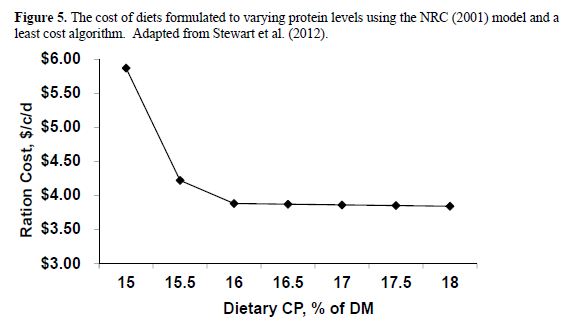
If one assumes the RDP requirement is over-predicted by 0.5 per cent unit, then the above analyses (When using the NRC model to balance a given ration at differing levels of dietary protein, one can assess the potential for saving money by removing all constraints from CP and relying on the model to solve for rations that meet RDP and MP requirements. Such an exercise is demonstrated in Error! Not a valid bookmark self-reference. with Eastern US ingredients at prevailing prices in 2011. From that work, it is apparent that diets can be formulated to meet NRC requirements down to at least 16 per cent CP, although the cheapest ration was at the highest level of protein. As protein costs increase relative to dietary energy costs, such low protein rations could become cost beneficial. Thus, it is important to allow the models to work without placing arbitrary limits on dietary protein content. Least cost rations, containing 16 per cent CP that still meet NRC requirements, can only be achieved if arbitrary minimums are not placed on dietary CP content.
Figure 5) would likely shift downward by a 0.5 per cent unit. Instead of a minimum effective dietary CP content of 16 per cent, one should be able to work down to a 15.5 per cent dietary protein range. If the same or even greater is true for RUP given a proper mix of AA, it should be possible to balance rations for less than 14.5 per cent protein for high producing cows. Such a level of intake would achieve an efficiency of 30 per cent which is half way to our goal of 35 per cent efficiency. Achieving 35 per cent efficiency (11.5 per cent CP diets) likely requires much more precise AA supply and requirement prediction equations so that diets can be formulated for AA as well as MP.
Amino Acid Requirements
The challenge of predicting AA supply and requirements for ruminants is much greater than for monogastric species. Flow of AA from the rumen is a function of the AA content of undigested feed protein, microbial protein, and sloughed digestive tract cells and secretions (NRC, 2001). The difficulty of predicting each of these entities has greatly hampered our ability to derive AA requirements based on performance data as is done with swine and poultry. Most of the progress that has been made in ruminants has occurred through the use of catheterized and cannulated animals, allowing the provision of AA post-ruminally (for example Haque et al., 2012). However, this is very intensive and expensive work. To date we have amassed the most information on methionine and lysine with histidine results appearing more recently (Korhonen et al., 2000; Noftsger and St-Pierre, 2003; Rulquin et al., 1993). We are far from the level of understanding that the swine and poultry people have of the remaining essential AA requirements and likely not to achieve that level of understanding any time in the near future.
As AA requirements are expressed as a percentage of MP supply, the problem with variable efficiency of MP use and over-predicting the marginal responses of milk protein to changing MP supply is partially propagated in existing AA requirement equations and likely contributing to the lack of accuracy and precision in those equations (NRC, 2001). Work at the tissue level, using multi-catheterized animals, has clearly shown that the liver and gut tissues remove a constant fraction of AA from blood presented in each pass by that tissue. Because mammary tissue does not generally remove more than half of the AA presented to it, there is significant recycling to the gut and liver resulting in additional removal. This is magnified as AA supply increases relative to energy supply, as the mammary tissue has the ability to change its removal of AA to meet its needs(Bequette et al., 2000).
So if mammary tissue is presented with a good energy supply, it will capable to produce milk near its maximum potential and will increase its AA extraction efficiency to achieve this. The same will happen if energy is held constant and AA supply is reduced. Conversely if the mammary tissue is presented with inadequate energy, it will reduce its use of AA and reduce extraction from blood. In the former case, less AA are recycled to the liver and gut, less are catabolized, and AA extraction efficiency is increased. In the latter case, more AA are recycled, catabolism increases, and AA extraction efficiency decreases. So, assuming a constant efficiency of post-absorptive AA use for milk protein synthesis is clearly wrong.
The above interactions between energy and AA supplies to the mammary tissue are mediated by intracellular signaling that integrates information regarding the intracellular supply of several key AA (Appuhamy et al., 2012; Appuhamy et al., 2011), the supply of energy in the cell (Appuhamy et al., 2009), and hormonal signals indicating overall animal status, i.e. insulin (Appuhamy et al., 2011) and probably IGF-1. Because these 3 entities all interact to set the overall rate of milk protein synthesis, and because the tissue can adapt its AA extraction capacity to meet intracellular AA demand, the concept of a single limiting AA or even a nutrient is wrong.
The first limiting nutrient and AA concept is based on the hypothesis commonly called the Law of the Minimum, which Sprengel (1828) formulated based on plant growth responses to soil minerals. The original hypothesis stated that a nutrient can limit plant growth, and when limiting, growth will be proportional to supply. Von Liebig (see Paris, 1992 for a translation) subsequently restated the hypothesis in stronger terms indicating that if a nutrient was limiting for growth, responses to other nutrients could not occur (von Liebig, 1862). Mitchell and Block (1946) used von Liebig’s extension of Sprengel’s hypothesis to develop the concept of the order of limiting AA which is commonly described using the analogy of a water barrel with broken staves.
Based on this formulation, if any nutrient is limiting milk production, then only the addition of that nutrient to the diet will result in a positive milk yield response, e.g. the single limiting nutrient paradigm. In order to determine which nutrient is most limiting, one must be able to calculate the allowable milk yield from that nutrient. That calculation is quite simple if one assumes a constant transfer efficiency, as is the case in the NRC model. However, as discussed above, transfer efficiency of AA is not fixed. Because AA removal from blood is regulated in concert with needs for milk protein synthesis (Bequette et al., 2000), the efficiency of AA transfer from the gut to milk protein is variable thus violating one of von Liebig’s assumptions.
Integration of signals arising from several AA, energy supply in the mammary cells, and hormonal signals to set rates of milk protein synthesis also violates the assumption that only one nutrient can be limiting production. If more of one nutrient or hormone can offset less of another, there are almost an infinite number of combinations of AA, energy substrates, and hormonal concentrations that will result in the very same amount of milk. This concept is demonstrated in vivo by the work of Rius et al. (2010a) in Figure 6. More of any one AA, while all others are held constant, will push milk protein synthesis higher regardless of which is perceived to be “first limiting” (Clark et al., 1978; Hanigan et al., 2000). Therefore, current protein and AA requirement models for lactation inappropriately represent the underlying biology, which leads to large prediction errors. The take home message from this discussion is that rations can be balanced at levels well below 15 per cent CP, probably even below 13 per cent, if we are able to reliably match AA supply with true animal needs. But current models of AA requirements used in field application programs appear to be incompatible with making such predictions. We are in the process of devising a new prediction scheme that will be a better representation of the biology, and thus should provide much greater accuracy allowing us to achieve N efficiencies of 35 per cent in lactating cattle.
Figure 6. Milk yield and metabolizable protein efficiency of conversion to milk protein in response to varying energy and ruminally undegraded protein supply. From Rius et al. (2010). HEHP = 1.54 MCal/kg; 11.8 per cent MP; HELP = 1.54 MCal/kg, 9.5 per cent MP; LEHP = 1.45 MCal/kg, 11.8 per cent MP; LELP = 1.45 MCal/kg, 9.5 per cent MP.
.JPG)
Milk Urea Nitrogen as a Tool to Monitor Feeding Programs
Synthesized urea is released into blood and equilibrates with body fluids including milk (Broderick and Clayton, 1997) resulting in high correlations among blood urea N, milk urea N (MUN), dietary N, and N balance in the cow (Preston et al., 1965). If protein in the diet is deficient relative to cow requirements, AA catabolism will be minimized resulting in low urea synthesis and concentrations of urea in blood and milk. Conversely if dietary protein is in excess, AA catabolism will increase resulting in greater urea synthesis and concentrations of urea in blood and milk. Thus, protein feeding can be adjusted based on MUN concentrations to achieve maximal efficiency without compromising milk production. Because kidney urea clearance is concentration dependent, there is also a high correlation between MUN and urinary N excretion (Jonker et al., 1998). Milk urea N is also a good indicator of ammonia emissions from dairy manure (Burgos et al., 2007). These relationships and routine measurement of MUN by milk processors and DHIA testing laboratories provides a useful tool for monitoring feeding programs and feed management practices to achieve maximum N efficiency and minimum environmental loading (NRCS, 2011).
Although MUN concentration is clearly related to protein sufficiency, there are several factors that can cause deviations from expected values. These include time of sampling, season of the year, body weight, breed, and nutritional factors (Broderick and Clayton, 1997; DePeters and Cant, 1992; Kauffman and St-Pierre, 2001). There are also significant cow effects (Wattiaux et al., 2005) that are at least partially explained by genetic variance (Miglior et al., 2007; Mitchell et al., 2005; Stoop et al., 2007; Wood et al., 2003). Given the genetic effects on MUN, it is possible that sire selection decisions within a herd may result in herd concentrations of MUN differing from the expected values based on feed management.
When the model of Kauffman and St-Pierre (2001) was used to predict MUN concentrations for individual cows in trials performed by Cyriac et al. (2008) and Rius et al. (2010), the variance in residual MUN associated with cow was 4.1 ± 1.1 mg/dl (P<0.001), indicating that individual cows can deviate considerably from the expected MUN value given a defined diet (Aguilar et al., 2012). Aguilar et al. (2012) also observed highly significant cow effects and a strong trend for a herd effect(P<.08) when analyzing data from 6 herds in the state of Virginia after corrections for differences in dietary nutrients and level of production. Least squares means for MUN by herd ranged from a low of 13.6 mg/dl to a high of 17.3 mg/dl. Given that a percentage unit change in dietary CP, e.g. 17 per cent to 16 per cent, results in a 1.1 mg/dl change in MUN, the herd with the highest MUN would have had to reduce dietary CP to 12.8 per cent to achieve the commonly accepted MUN target of 12 mg/dl, if all other factors are held constant. Thus, it is important to recognize that not all herds can be expected to achieve the same target MUN, and herd specific calibrated targets are required if maximal efficienc is to be achieved and maintained.
Herd calibration can be achieved through an assessment of the herds feeding program, taking into account all possible factors that may affect observed variation in MUN. If the herd is well managed, fed a balanced diet that does not exceed NRC (2001) requirements for protein, and the diet has adequate energy, the prevailing MUN could serve as a calibrated target value for that herd. If the herd is overfeeding protein relative to energy supply and milk production, the ration would have to be rebalanced and fed for a period of 2 or 3 weeks before reassessing MUN. The MUN value achieved after this period of feeding to requirements reflects the calibrated NRC reference target for the herd. At this MUN level, a diet balanced properly for RDP and RUP should not precipitate a protein deficiency.
Given a reference MUN target for the herd, one can then determine if the herd will tolerate lower RDP and RUP feeding levels. Because RUP costs considerably more than RDP, it makes sense to start with RUP calibration first. After feeding the diet balanced to NRC requirements, reduce the RUP content of the diet by 0.25 per cent or 0.5 per cent units while holding energy and RDP content constant. Feed the diet for a period of 2 weeks and determine if any loss in milk production or DM intake has occurred while also recording MUN content. If there is no loss in production or intake, try removing another 0.25 per cent units from RUP and again assess production, intake, and MUN after another 2 weeks. Any loss in production will be much less than that predicted by the NRC model because it overpredicts responses. Once a loss is experienced, add back the last reduction in RUP and store this value as your target RUP content and MUN target level for that herd.
Having established a herd specific RUP feeding level, you can try reducing RDP content if economically favorable. Remove 0.25 per cent or 0.5 per cent units of RDP from the diet while holding energy content constant and RUP at the newly established level. Again feed the diet for 2 weeks and monitor DM intake, production, and MUN. Note that DM intake will generally change before milk production. If no loss in production or intake, remove another 0.25 per cent units of RDP and repeat the process. Once a loss of DM intake or production occurs, add back the last increment of RDP and store this value as your target RDP content for that herd. Also store the new MUN value as your target MUN for the herd.
This herd specific MUN target can be used to monitor your feeding program. If MUN drops below the target value, it is highly likely that a loss in production will follow soon and corrective action should be taken immediately. Note that a drop in MUN does not provide any information regarding whether the problem is with RDP or RUP. It simply tells you the animal is short on N relative to its current level of production. You will have to determine whether it is a problem with RDP, RUP, other dietary factors such as energy and fiber, or animal health. It also important to recognize that the amount of salt in the ration will affect MUN (Spek et al., 2012), so make sure salt inclusion remains constant and similar to the level used when determining the target MUN values.
February 2014
ReferencesAguilar, M., M. D. Hanigan, H. A. Tucker, B. L. Jones, S. K. Garbade, M. L. McGilliard, C. C. Stallings, K. F. Knowlton, and R. E. James. 2012. Cow and herd variation in milk urea nitrogen concentrations in lactating dairy cattle. J Dairy Sci 95(12):7261-7268. Aguilar, M., M. E. Van Amburgh, W. A. D. Nayananjalie, and M. D. Hanigan. 2011. Effect of cow variation on the efficiency of nitrogen recycling to the rumen in dairy cattle. J. Dairy Sci. 94(ESuppl. 1):122. Allen, M. S. 2000. Effects of diet on short-term regulation of feed intake by lactating dairy cattle. J. Dairy Sci. 83:1598-1624. Appuhamy, J. A., N. A. Knoebel, W. A. Nayananjalie, J. Escobar, and M. D. Hanigan. 2012. Isoleucine and leucine independently regulate mTOR signaling and protein synthesis in MAC-T cells and bovine mammary tissue slices. J Nutr 142(3):484-491. Appuhamy, J. A. D. R. N., A. L. Bell, W. A. D. Nayananjalie, J. Escobar, and M. D. Hanigan. 2011. Essential amino acids regulate both initiation and elongation of mRNA translation independent of insulin in MAC-T Cells and bovine mammary tissue slices. The Journal of Nutrition 141(6):1209- 1215. Appuhamy, J. A. D. R. N., C. T. Bray, J. Escobar, and M. D. Hanigan. 2009. Effects of acetate andessential amino acids on protein synthesis signaling in bovine mammary epithelial cells in-vitro. J. Dairy Sci. 92(e-Suppl1):44. Baker, D. H. 1996. Advances in amino acid nutrition and metabolism of swine and poultry. Pages 11-22 in.Nutrient management of food animals to enhance and protect the environment. E. T. Kornegay, ed. CRC Lewis Publishers, Boca Raton, FL. Bequette, B. J., M. D. Hanigan, A. G. Calder, C. K. Reynolds, G. E. Lobley, and J. C. MacRae. 2000. Amino acid exchange by the mammary gland of lactating goats when histidine limits milk production. J. Dairy Sci. 83:765-775. Broderick, G. A. and M. K. Clayton. 1997. A statistical evaluation of animal and nutritional factors influencing concentrations of milk urea nitrogen. J Dairy Sci 80(11):2964-2971. Burgos, S. A., J. G. Fadel, and E. J. DePeters. 2007. Prediction of Ammonia Emission from Dairy Cattle Manure Based on Milk Urea Nitrogen: Relation of Milk Urea Nitrogen to Urine Urea Nitrogen Excretion. Journal of Dairy Science 90(12):5499-5508. Caraviello, D. Z., K. A. Weigel, P. M. Fricke, M. C. Wiltbank, M. J. Florent, N. B. Cook, K. V. Nordlund, N. R. Zwald, and C. L. Rawson. 2006. Survey of Management Practices on Reproductive Performance of Dairy Cattle on Large US Commercial Farms. J. Dairy Sci. 89(12):4723-4735. Christensen, R. A., M. R. Cameron, J. H. Clark, J. K. Drackley, J. M. Lynch, and D. M. Barbano. 1994. Effects of amount of protein and ruminally protected amino acids in the diet of dairy cows fed supplemental fat. J. Dairy Sci. 77(6):1618-1629. Christensen, R. A., M. R. Cameron, T. H. Klusmeyer, J. P. Elliott, J. H. Clark, D. R. Nelson, and Y. Yu. 1993. Influence of amount and degradability of dietary protein on nitrogen utilization by dairy cows. J. Dairy Sci. 76(11):3497-3513. Clark, R. M., P. T. Chandler, and C. S. Park. 1978. Limiting amino acids for milk protein synthesis by bovine mammary cells in culture. J Dairy Sci 61(4):408-413. Cyriac, J., A. G. Rius, M. L. McGilliard, R. E. Pearson, B. J. Bequette, and M. D. Hanigan. 2008. Lactation performance of mid-lactation dairy cows fed ruminally degradable protein at concentrations lower than National Research Council recommendations. J. Dairy Sci. 91(12):4704- 4713. DePeters, E. J. and J. P. Cant. 1992. Nutritional factors influencing the nitrogen composition of bovine milk: a review. J Dairy Sci 75(8):2043-2070. Firkins, J. L., L. L. Berger, N. R. Merchen, G. C. J. Fahey, and D. R. Nelson. 1986. Effects of feedintake and protein degradability on ruminal characteristics and site of digestion in steers. J. Dairy Sci. 69(8):2111-2123. Hanigan, M. D., J. P. Cant, D. C. Weakley, and J. L. Beckett. 1998. An evaluation of postabsorptive protein and amino acid metabolism in the lactating dairy cow. J. Dairy Sci. 81(12):3385-3401. Hanigan, M. D., J. France, L. A. Crompton, B. J. Bequette, J. P. McNamara, and D. E. Beever. 2000. Evaluation of a representation of the limiting amino acid theory for milk protein synthesis. Pages 127-144 in Modelling Nutrient Utilization in Farm Animals. CABI Publishing, Wallingford, UK. Haque, M. N., H. Rulquin, A. Andrade, P. Faverdin, J. L. Peyraud, and S. Lemosquet. 2012. Milk protein synthesis in response to the provision of an "ideal" amino acid profile at 2 levels of metabolizable protein supply in dairy cows. J Dairy Sci 95(10):5876-5887. Hristov, A. N., W. J. Price, and B. Shafii. 2004. A meta-analysis examining the relationship among dietary factors, dry matter intake, and milk and milk protein yield in dairy cows. J. Dairy Sci. 87(7):2184-2196. Jonker, J. S., R. A. Kohn, and R. A. Erdman. 1998. Using milk urea nitrogen to predict nitrogen excretion and utilization efficiency in lactating dairy cows. J. Dairy Sci. 81:2681-2692. Kalscheur, K. F., R. L. Baldwin, VI, B. P. Glenn, and R. A. Kohn. 2006. Milk production of dairy cows fed differing concentrations of rumen-degraded protein. J. Dairy Sci. 89(1):249-259. Kauffman, A. J. and N. R. St-Pierre. 2001. The relationship of milk urea nitrogen to urine nitrogen excretion in Holstein and Jersey cows. J Dairy Sci 84(10):2284-2294. Knapp, J. R. 2009. The good news: feed costs have declined over the past year. Buckeye News. http://dairy.osu.edu/bdnews/bdnews.html. Korhonen, M., A. Vanhatalo, T. Varvikko, and P. Huhtanen. 2000. Responses to graded postruminal doses of histidine in dairy cows fed grass silage diets. J. Dairy Sci. 83(11):2596-2608. Lapierre, H., G. E. Lobley, D. R. Ouellet, L. Doepel, and D. Pacheco. 2007. Amino acid requirements for lactating dairy cows: Reconciling predictive models and biology. Pages 39-59 in Proc. Cornell Nutrition Conference for Feed Manufacturers. Dept. of Anim. Sci., Cornell Univ., New York. Li, L., J. Cyriac, K. F. Knowlton, L. C. Marr, S. W. Gay, M. D. Hanigan, and J. Arogo Ogejo. 2009. Effects of reducing dietary nitrogen on ammonia emissions from dairy barn floor. Journal of Environmental Quality 38:9. Miglior, F., A. Sewalem, J. Jamrozik, J. Bohmanova, D. M. Lefebvre, and R. K. Moore. 2007. Genetic Analysis of Milk Urea Nitrogen and Lactose and Their Relationships with Other Production Traits in Canadian Holstein Cattle. Journal of Dairy Science 90(5):2468-2479. Mitchell, H. H. and R. J. Block. 1946. Some relationships between the amino acid contents ofproteins and their nutritive values for the rat. Journal of Biological Chemistry 163(3):599-620. Mitchell, R. G., G. W. Rogers, C. D. Dechow, J. E. Vallimont, J. B. Cooper, U. Sander-Nielsen, and J. S. Clay. 2005. Milk urea nitrogen concentration: heritability and genetic correlations with reproductive performance and disease. J Dairy Sci 88(12):4434-4440. Noftsger, S. and N. R. St-Pierre. 2003. Supplementation of methionine and selection of highly digestible rumen undegradable protein to improve nitrogen efficiency for milk production. J. Dairy Sci. 86(3):958-969. NRC. 1989. Nutrient requirements of dairy cattle, 6th ed. National Academy Press, Washington, DC. NRC. 2001. Nutrient requirements of dairy cattle, 7th rev. ed. National Academy Press, Washington, D.C. NRCS. 2011. Conservation practice standard: feed management (Code 592). Natural Resources Conservation Service, Washington, D.C. Paris, Q. 1992. The von Liebig hypothesis. American Journal of Agricultural Economics 74(4):1019- 1028. Preston, R. L., D. D. Schnakenberg, and W. H. Pfander. 1965. Protein utilization in ruminants: I. blood urea nitrogen as affected by protein intake. J. Nutr. 86(3):281-288. Rius, A. G., M. L. McGilliard, C. A. Umberger, and M. D. Hanigan. 2010. Interactions of energy and predicted metabolizable protein in determining nitrogen efficiency in the lactating dairy cow. J. Dairy Sci. 93(5):2034-2043. Rulquin, H., P. M. Pisulewski, R. Verite, and J. Guinard. 1993. Milk production and composition as >a function of postruminal lysine and methionine supply: a nutrient-response approach. Live.Prod.Sci. 37:69-90. Santos, F. A. P., J. E. P. Santos, C. B. Theurer, and J. T. Huber. 1998. Effects of rumen-undegrdable protein on dairy cow performance: a 12-year literature teview. J. Dairy Sci. 81:3182-3213. Spek, J. W., A. Bannink, G. Gort, W. H. Hendriks, and J. Dijkstra. 2012. Effect of sodium chloride intake on urine volume, urinary urea excretion, and milk urea concentration in lactating dairy cattle. J. Dairy Sci. 95(12):7288-7298. Sprengel, C. 1828. Von den substanzen der ackerkrume und des untergrundes (About the substances in the plow layer and the subsoil). Journal für Technische und Ökonomische Chemie 3:42-99. St-Pierre, N. 2012. The costs of nutrients, comparison of feedstuffs prices and the current dairy situation. Buckeye News. http://dairy.osu.edu/bdnews/bdnews.html. Stewart, B. A., R. E. James, M. D. Hanigan, and K. F. Knowlton. 2012. Technical Note: Cost of reducing protein and phosphorus content of dairy rations. The Professional Animal Scientist 28(1):115-119. Stoop, W. M., H. Bovenhuis, and J. A. M. van Arendonk. 2007. Genetic Parameters for Milk Urea Nitrogen in Relation to Milk Production Traits. Journal of Dairy Science 90(4):1981-1986. von Liebig, J. 1862. Die chemie in ihrer anwendung auf agricultur und physiologie. Vol. II. 7. Aufl ed. Friedrich Vieweg, Braunschweig. Wattiaux, M. A., E. V. Nordheim, and P. Crump. 2005. Statistical evaluation of factors and interactions affecting dairy herd improvement milk urea nitrogen in commercial midwest dairy herds. J. Dairy Sci. 88(8):3020-3035. Wolfe, A. H. and J. A. Patz. 2002. Reactive nitrogen and human health: acute and long-term implications. Ambio. 31(2):120-125. Wood, G. M., P. J. Boettcher, J. Jamrozik, G. B. Jansen, and D. F. Kelton. 2003. Estimation of genetic parameters for concentrations of milk urea nitrogen. J. Dairy Sci. 86(7):2462-2469.