

Carbon Footprints Of Dairy Farming Systems
As climate change has gained in prominence in the international debate environmental sustainability and greenhouse gas (GHG) emissions of dairy farming systems are becoming increasingly important aspects of dairy production, even for small-scale systems.Introduction
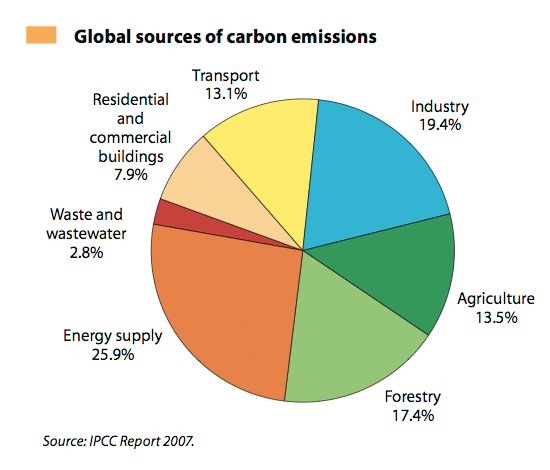
Measurement and attribution of GHG emissions is challenging and the aim of the present study was to initiate the development of a methodology to estimate GHG emissions from typical dairy production systems. Because dairy cows are seen as a major contributor of global GHG emissions, an attempt was made to estimate their share in the global total.
Methodology
Estimates of the contribution of dairy farming to global GHG emissions were made based on IPCC and FAO reports. For details, see the explanations below. The estimates of GHG emissions by dairy farming system draws on the IFCN database of typical dairy farms and uses key variables such as number of cows, number of heifers, milk yield, use of fertilizer, electricity, fuel and purchased feed, and live weight of cows. Ratios such as amounts of fuel or of compound feed used per 100 kg of milk were then derived from these figures. Next, emissions of CO2, CH4 and N2O were estimated. For example, the CH4 emission from the rumen was estimated based on the function CH4 (kg) = 55 + 4.5* milk yield per day (kg milk/ cow/day) + 1.2 * (metabolic weight) (Kirchgessner et al., 1992). Similarly, gas emissions from manure handling, concentrates, fuel and energy use, fertilizer production, buildings and machinery, etc. were estimated and attributed to the system. This approach thus includes the GHG emissions from purchased feed, heifer raising, and all inputs used.Moreover the analysis has considered the output of beef and livestock from the dairy farm as credits. GHGs from (long-distance) transport of concentrates, replacement heifers reared on other farms were not considered in this analysis. Finally, the emissions of the diferent gases were converted into CO2 equivalents by using the coeficients shown below. Forty-six typical dairy farms in 38 countries were included in for the analysis.
Global carbon footprint of milk production
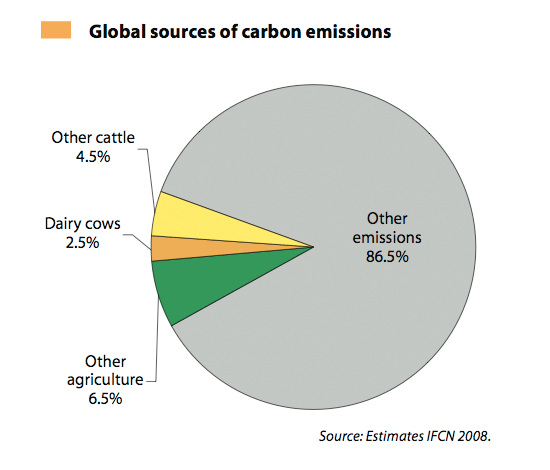
The two simple calculations of global share of GHG emissions from dairy farming, based on IPCC and FAO data indicate that dairy cows contribute between 2.2 and 2.5 percent of all global GHG emissions. It should be noted that these figures are based on very simple calculations and do not attribute deforestation to dairy farming
Carbon footprints of dairy farming systems
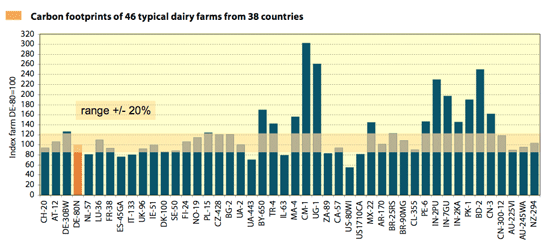
In the chart, the emissions per 100 kg of milk from the typical 80-cow farm in Germany are taken as point of reference (= 100). Half of the farm types analysed had carbon footprints of +/- 20 percentage points with respect to the reference farm. The low-yield farming systems in Africa and South Asia showed the highest carbon footprints per 100 kg of milk, while high-yield farming systems showed significantly lower emissions.
Emission by types of gases
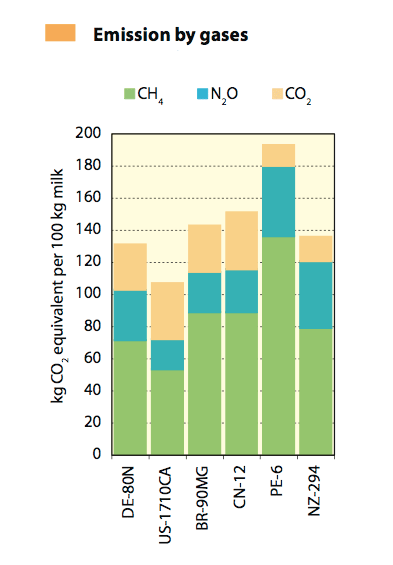
The most important gas was methane (CH4), which contributed 50 to 70 percent of the greenhouse gas emissions calculated as CO2 equivalents. The emissions from N2O and CO2 together accounted for 30 to 50 percent of total emissions. The amounts of N2O and CO2 varied, depending on emissions from manure handling and on the amount of purchased feed, fertilizer and energy use.
Emission by activities
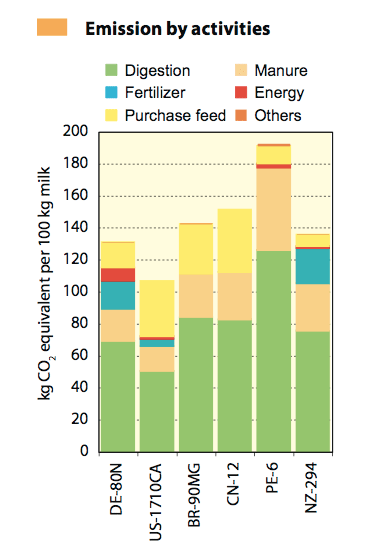
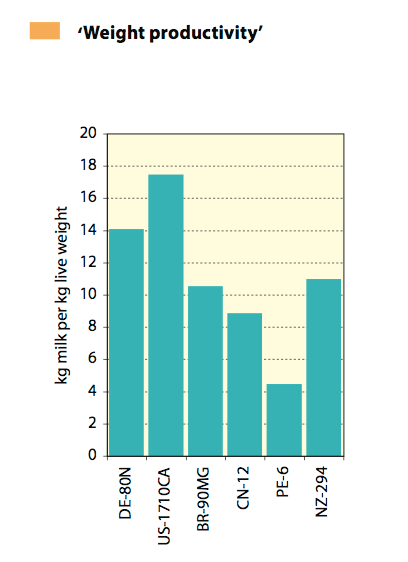
The main source of GHG emissions was the digestion in the rumen, which accounted for about 50 to 70 percent of the total. Therefore the key determinant of the carbon footprints of dairy systems is milk production by body weight, i.e. the higher the milk production per kg bodyweight (weight productivity), the lower the carbon footprints. Therefore, low-yield dairy farming systems have more emissions per kg of milk than high-yield systems. Depending on the farming system, the next-ranked sources of GHG emission were manure handling and storage at 10 to 20 percent, the volume of purchased feed at 5 to 10 percent, and fertilizer use at up to 10 percent. The use of energy in the form of electricity and fuel accounted for only 5 to 10 percent of GHGs.
Conclusion
This study represents a first attempt to estimate the carbon footprints of dairy farming systems on the basis of IFCN’s farm data. The strength of the approach does not lie in producing exact carbon footprints, but in providing a range in which the footprints could fall. The results show significant differences among farm types and indicate that ‘weight productivity’ is the key determinant.
