

US Beef and Dairy Outlook Report - April 2010
First-quarter 2010 commercial cow slaughter is expected to be the highest first-quarter slaughter since 1997, high prices are welcomed by producers. In the dairy sector, the rate of decline in the dairy herd has slowed down and production per cow is continuing to rise. However over-supply of milk may limit immediate price increases, according to the USDA Beef and Dairy Outlook Report.
Beef/Cattle Summary
First-quarter 2010 commercial cow slaughter is expected to be the highest first-quarter slaughter since 1997. High prices and prospects for good pastures are giving cattle producers at all levels a much-appreciated break from low-to-negative returns.
Dairy Summary
Milk production is forecast at 189.9 billion pounds in 2010. The rate of decline in the Nation’s dairy herd has slowed, and production per cow is continuing to rise. The added milk, along with plentiful stocks of most dairy products, will limit price increases over the next few months. Rising export prospects and improved domestic demand could lift prices by year’s end.
Beef/Cattle
Cow Slaughter Continues Unabated Through March
US cow slaughter continues, spurred by high demand and prices for processing beef. While dairy cow slaughter increased until the week of 13 March, they have made up an increasing share of weekly federally inspected cow slaughter since. Weekly beef cow slaughter has made up a larger share of total federally inspected cow slaughter than for the same weeks in 2009. Commercial cow slaughter in firstquarter 2010 could be the highest first-quarter quantity since 1997. Year-to-date weekly imports of Canadian cows into the United States for slaughter were up by 29 per cent through April 3 compared with the same period last year. Exported partly because of dry pasture conditions in Canada, these cows account for about 4 per cent of year-to-date weekly federally inspected cow slaughter levels. Cow slaughter at current rates could set the stage for a lower year-over-year cow inventory on 1 January 2011. However, current feeder cattle prices and feedlot margins are expected to mitigate beef cow slaughter rates at some point soon as cattle producers view those cows as more valuable for producing a higher valued product than they did just a few weeks ago.
Fed Cattle Prices Lead to Positive Margins for Beef Cattle Sectors
US feeder cattle prices have increased rapidly since January 2010 and are well above last year's prices. Average monthly prices in March for Medium and Large Number 1 500- to 550-pound (lb) feeder steers in Oklahoma City were 11 per cent higher than January 2010 prices and 12 per cent higher than in March 2009 prices when drought adversely affected prices for lightweight feeder cattle for grazing native pastures during the summer. Compared with supplies in first-quarter 2009, relatively shorter supplies of heavier feeder cattle, combined with sharply higher fed cattle prices, have also had a positive effect on heavier weight feeder cattle for feedlot placements. March prices for Medium and Large Number 1 750- to 800-lb feeder steers in Oklahoma City averaged 7 per cent above January 2010 prices and 14 per cent above year-earlier prices.
Cattle feeding margins were positive for the first quarter of 2010 for the first time since the first quarter of 2008. Current fed cattle price levels at or near $100 per hundredweight (cwt) will continue to provide positive cattle feeding margins and further incentives to cattle feeders over the near term. These incentives could feed into some combination of two possible scenarios: In a short-term scenario, some fed cattle could be marketed earlier—pulled forward—than they might have been under more normal circumstances in order to capture the positive margins in the shorter run. Pulling cattle forward would lead to reduced dressed weights and more Selectgrading cattle in the slaughter mix. However, the total impact on beef production remains uncertain because it is a function of both the number of cattle slaughtered and their weights at slaughter. An alternative short-term view is the possibility that feeder cattle prices in the relatively high $110-plus range might not encourage additional feedlot placements, even with the declining corn price outlook, if the impact of increases in feeder cattle prices more than offsets the impact of declines in corn prices for cattle feeding margins. Producers could also consider a longer term view toward setting themselves up to produce calves in later years to capture higher prices as a result of expected fewer supplies of feeder cattle.
This view could motivate retention of additional heifers for breeding, which would have a short-term effect of reducing inventories of heifers available as placements in feedlots.
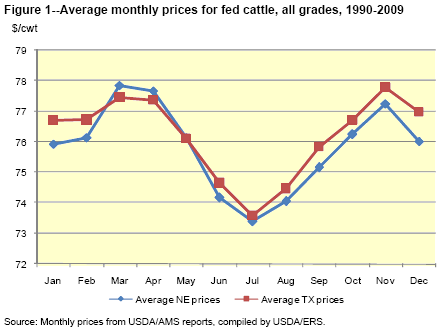
Consistent with seasonal fluctuations in regional fed cattle price relationships (see special article), fed cattle prices beginning the week of 27 March in Nebraska exceeded those in the Southern Plains. This seasonal price pattern is a result of the relatively greater scarcity of finished yearling cattle in Nebraska and the Corn Belt at this time of the year compared with the cattle in Southern Plains feedlots and the willingness of packers to bid more for them. The relatively larger supplies of calves placed on feed last fall after weaning—calf-feds—also contributes to the seasonal decline in dressed weights as these cattle go to market.
Wholesale cutout values for both Choice and Select beef have also continued to increase. As the spring and summer grilling season approaches, prices for the prime cuts that are the source of grilling cuts increase. At the same time, the per centage of carcasses grading Choice or better has begun its seasonal decline. Retail prices, which were just beginning to respond to lower cutout values earlier in the year, inched back up for March 2010. Choice retail beef prices in March were up by 3 per cent over January prices, virtually unchanged from the March 2009 price. Narrowing price spreads from feedlot to retail, as observed over first-quarter 2010, are likely to pressure both packers and retailers into price-increasing strategies. One such strategy is to reduce slaughter levels to keep wholesale prices high and put downward pressure on fed cattle prices. With feedlots as current as observers indicate, price-increasing strategies are not likely to be as effective as they have been in periods of plentiful supplies of fed cattle.
Special Article Summary
Southern Plains Cattle Sell at a Premium to Northern-Central Plains Cattle
Kenneth H. Mathews, Jr.
Rachel J. Johnson
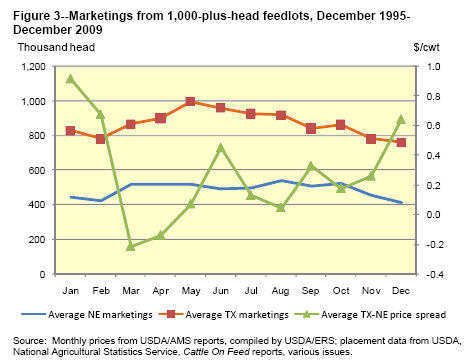
The North-South (N-S) spread is a persistent difference in prices for fed cattle from the Northern and Central Plains (NE) and the Southern Plains (TX), with Southern Plains cattle generally selling at a premium to Northern cattle. The N-S spread is defined here as the observed difference between all-grade prices for Nebraska 1,100- to 1,300-pound (lb) steers and prices for Southern Plains (Texas, Oklahoma, and New Mexico) 1,100- to 1,300-lb steers (for example, see USDA, Agricultural Marketing Service (AMS), LM_CT175, and LM_CT173) (figs. 1 and 3). The N-S spread arises due to complex dynamics among:
- The quality, age, and size of cattle when marketed,
- The particular characteristics of feeder cattle production systems,
- The timing throughout the production process,
- Regional marketing conventions, and
- Corn/feed prices in the two regions.
These price differences are also a result of the way in which aggregates across variations in marketing strategies and local conventions, such as adjustments for losses in transit and who (feedlot or packer) is paying for transportation costs, are being reported to the mandatory price reporting system. There are also seasonal elements to the spread, often inverting in March-April and widening in the fall.

Northern cattle are characteristically of higher average quality than southern cattle, and higher quality cattle ordinarily are priced at a premium to lower quality cattle. The observed N-S spread runs counter to the typical premiums paid for quality. For example, the N-S spread in 2009 averaged $1.12 per hundredweight (cwt) across all grades and qualities. In 2009, 46 per cent of negotiated purchases of Nebraska fed cattle were in the 65- to 80-per cent Choice range, whereas 92 per cent of Texas- Oklahoma-New Mexico cattle were in the 35- to 65-per cent Choice range (USDA, AMS, LM_CT175, and LM_CT173).
At times, especially when fed cattle are relatively plentiful, cattle feeders and packers cannot agree on prices and the cattle will remain on feed long enough to become “over finished.” These cattle can weigh more and possibly be priced at a discount. At the extreme, these heavier cattle often sell at lower prices than lighter cattle. Northern cattle are generally heavier by a hundred lbs or more when marketed than southern cattle. In 2009, Nebraska fed cattle averaged 1,398 lbs (live weight across all quality categories), while the average was 1,283 lbs for Texas- Oklahoma-New Mexico cattle.
Fed cattle are sold out of feedlots in a number of ways. Some are sold as live animals with an adjustment—shrink—for weight they will lose in transit from the feedlot to the packer. Others are sold as hanging carcasses, usually with no adjustment for shrinkage. In the eastern portions of the northern cattle feeding areas, cattle are often sold with a 3-per cent shrink—that is, packers pay on actual live weight adjusted downward by 3 per cent. Southern cattle and some cattle from western portions of the northern cattle feeding areas are often sold with a 4-per cent shrink. These differences are not obvious in the AMS Mandatory Price reports, where they are aggregated as sold on a negotiated basis with 3-4 per cent shrinks. Holding other factors equal, such as live weight, quality, and distance to the packer, northern cattle could be expected to sell at a slightly lower price per cwt than southern cattle due to the differing shrink factors.
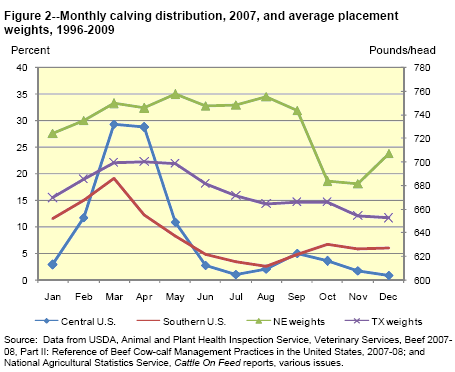
Overlapping seasonal and regional production patterns also play a role in the N-S spread as they affect relative supplies of feeder cattle and fed cattle. Nationwide, 54 per cent of the yearly calf crop is born during March-May (USDA, Animal and Plant Health Inspection Service, Veterinary Services, Beef 2007-08, Part II: Reference of Beef Cow-calf Management Practices in the United States, 2007-08, February 2009). The tendency for spring calving holds more rigidly in the North, where 69 per cent of calves are born during March-May. Some of these calves are placed in feedlots in October-November, just after weaning. Such young cattle on feed are referred to as “calf-feds. 1” Compared with the spring calving season in the North, the spring calving season in the South can be lengthier and a greater number of calves are born in the fall; thus, weaning and placements at weaning can be spread over a greater length of time. As a result, marketing of southern calf-feds is somewhat more spread out, relative to the North.
1 There are four general production systems for feeder cattle from weaning through slaughter, with many variations across these systems. The production systems differ primarily in length of time between weaning and feedlot placement: calf-fed, background lot, short-yearling, and long-yearling. Calf-feds are placed on feed at or shortly after weaning, weighing about 600 lbs and will be on feed for 7-9 months. Backgrounded calves and short-yearlings are placed on feed 4-6 months after weaning and weigh around 700-750 lbs. Long-yearlings have sometimes spent more than a year growing on pasture, weighing about 700- 900 lbs or more when placed in feedlots (Mark, D.R. Personal communication, December 22, 2009), though often for only 4-5 months.
For feeder cattle not placed on feed immediately after weaning, a greater number of grazing options are available in the South, particularly cool-season pastures, such as wheat pasture, through the winter months. Having more options provides southern producers with more flexibility in calving seasons and grazing programs. During March-June, placements may be calf-feds, fall calves carried through the winter, or calves that have grazed out wheat. Feedlot placements tend to increase sharply in March, when cattle must be removed from wheat to prevent damage to wheat plants destined for grain production.
Another minor peak occurs in May when wheat not intended for harvest is “grazed out.” There is also a May increase in northern feeder cattle placements in feedlots, mostly from short-yearling backgrounding programs in which cattle have been carried through the winter via some program, resulting in adequate growth to feedlot placement size. For example, more 700-lb and heavier cattle (longyearlings) are placed in NE than TX, and placements of these cattle peak in September-October, with their marketings of these cattle from feedlots beginning in late February (fig. 2).

The average monthly price differential between Texas and Nebraska (TX-NE) cattle decreases sharply in the early spring, bottoming in March-April when fall-placed calf-feds and long-yearlings begin coming to market as fed cattle (fig. 3). NE cattle, on average, carry a price premium over TX cattle during March-April. During these months, near-equal numbers of calf-feds come from both North and South, but fewer yearling placements are coming to market in the North. Packers in the North have three options: (1) they must bid a higher price for the northern yearlings due to their relative scarcity, (2) pay more for northern calf-feds, or (3) pay transportation costs for southern cattle. The spread is greatest in December-January, when fewer summer-placed cattle are marketed. The reduced marketings during the first quarter are due to low placement levels late in the previous summer. During December- January, supplies of heavier weight cattle are relatively lower in the Southern Plains feedlots, prompting packers to bid more for these cattle, which occurs just before calf-feds begin entering the market (May-July).

Other factors mitigate or exacerbate these overlapping tendencies. Some examples are the occurrence of regional dry periods and regional availability of various feedstuffs, such as corn gluten feed or distillers’ grains.
Dairy
Continued Increases in Milk Production in 2010 Are Likely To Limit Price Increases
The Nation’s dairy herd continues to contract on a year-over-year basis. However, milk per cow continues to rise incrementally. The April Milk Production report indicated that milk per cow was 51 pounds (lbs) higher in March compared with a year ago. Moderating feed prices for 2009/10 and the prospect of continued moderate feed prices into the next crop year have provided an incentive to increase output. However, lower milk prices have kept the milk-feed profitability ratio below 2.5. A milk-feed price ratio above 2.5 is considered necessary to begin any expansion. Although the US dairy herd continues to decline, the rate of decline appears to be moderating. The March Livestock Slaughter report showed 223,000 dairy cows slaughtered under Federal inspection in February, the second lowest total since last May. Meanwhile, producers added 3,000 cows in both January and February. For 2010, the US dairy herd is expected to average 9,065,000 cows, a 1.5 per cent decline from 2009, but somewhat higher than recent USDA estimates. Output per cow is projected at 20,950 lbs resulting in a forecast 189.9 billion lbs of milk in 2010.
Although stock estimates were slightly higher than forecast last month, ending stocks for 2010 on both a fats and skim-solid basis are still expected be below 2009. Ending stocks on a fats basis are projected to end 2010 at 10.4 billion lbs; stocks on a skim basis are forecast to end the year at 10.8 billion lbs. Most of the drawdown in stocks is likely to occur in the second half of 2010.
Commercial use is projected to reach 188.4 billion lbs in 2010 on a fats basis, up 1.3 per cent. Moderating prices for cheese and economic recovery are the basis for stronger domestic commercial use on a fats basis. The higher commercial domestic use should drawdown currently high cheese stocks over the course of the year and firm cheese prices by year’s end. Commercial use on a skim-solid basis is expected to reach 167.6 billion lbs, up 0.5 per cent from last year. Higher exports of powder, especially later in 2010, are expected to draw powder from the domestic market, strengthening prices for nonfat dry milk in the second half of 2010.
Commercial milk equivalent exports are forecast at 4.75 billion pounds and 25.4 billion pounds on a fats and skim-solid basis, respectively. Most of the expected increases are based on higher expected exports of butter, milk fat, and nonfat dry milk (NDM). While exports have been modest in the first quarter, movement is likely to improve in later quarters due to economic recovery in importing countries and tighter supplies from potential competitors.
Higher forecast milk production and relatively high cheese stocks suggest a scaleback in prices. Cheese prices could strengthen in the second half, if recovery continues and stocks are drawn down. Cheese prices are expected to average $1.490 to $1.540 per lb this year. Butter sales have been at least reasonable, and production will likely tighten seasonally as cream supplies move to production of ice cream. Butter prices are forecast to rise over the course of the year as demand improves despite second-half increases in milk production. Butter prices are expected to average $1.420 to $1.500 per lb in 2010.
NDM prices should climb in the second half of 2010 as exports increase. NDM prices are forecast to average $1.110 to $1.150 a lb in 2010. Whey prices have already rebounded from last year and are expected to remain near present levels for the balance of 2010. Prices will likely average 37.5 to 40.5 cents a lb this year.
As milk production increases encounter expected increases in demand, prices are likely to be higher than 2009 but not rise to 2007 or 2008 levels. The Class IV price is forecast at $13.40 to $14.00 per cwt in 2010. The Class III price is expected to average $14.10 to $14.60 per cwt, and the all milk price is forecast to average $15.45 to $15.95 per cwt.
Further Reading
| - | You can view the full report by clicking here. |
April 2010


